

Question: fast Question DA and Dive within the same com The home to man devis D A Carbuite ISO Number of stw being sold to outside
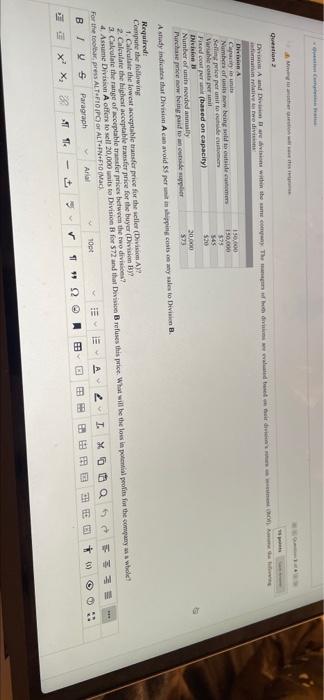
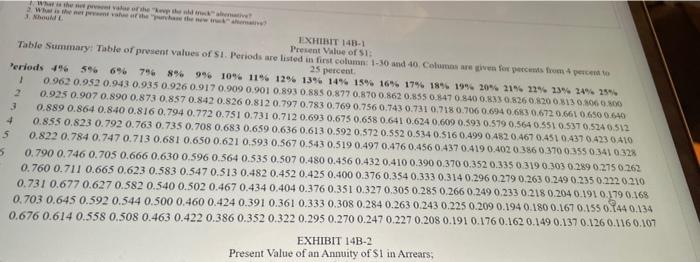
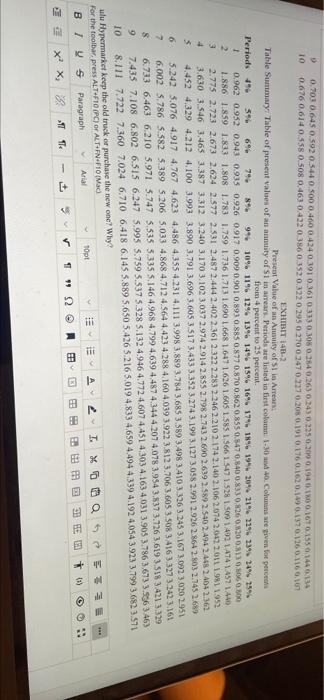
Question DA and Dive within the same com The home to man devis D A Carbuite ISO Number of stw being sold to outside 150,000 Selling price per unit to dete 573 Vale coste per il Fred cost per based on capacity) 52 IN vision Number of units needed army 20.000 Purchase price now being paid to outside oppler 573 Ashady indicates that Division A can avoid 55 per it wapping costs on my sales to Devision B. Required: Compute the following 1. Calculate the lowest acceptable transfer price for the seller (Division Ay? 2. Calculate the highest acceptable transfer price for the buyer Division By? 2. Calculate the range of acceptable transfer prices between the two divisions? Assume Division A offers to sell 20,000 units to Division it for 572 and that Division B refuses this price. What will be the loss in potential profits for the company whold For the toolba press ALT FOIP) or ALTHFNFO (Mad TVS Paragraph All 100 2TXO QE xx, i } * 12 AM When Wahhhhh NOME EXHIBIT 140-1 Table Summary: Table of prosent values of si. Periods are listed in first column: 1-30 and 4 Columns we given for percuts from percent Present Value of si: 25 percent Periods 496 596 696 7% 8% 9% 10% 11% 12% 13% 14% 15% 16% 17% 18%. 19% 20% 21% 22% 23% 24% 25% 1 0 962 0.952 0.943 0.935 0.926 0.917 0.909 0.901 0.893 0.885 0.8770.870 0.862 0,855 0.8470840 0.8330 8260.820 0.313 010600 2 0.925 0.907 0.890 0.873 0.8570.842 0.826 0.812 0.797 0.783 0.769 0.756 0.743 0.731 0.7180.7060.694 063 0672.06610650 0.640 3 0.889 0.864 0.8-40 0.816 0.794 0.772 0.751 0.731 0.712 0.693 0.675 0.658 0.641 0.624 0,609 0.593 0.5790,564 0.551 0.5370,524 0.512 4 0.855 0.823 0.792 0.763 0.735 0.708 0.683 0.659 0.636 0.613 0.592 0.572 0.552 0.534 0.516 0.499 0482 0.467 0.4510437 0423 0410 5 0.822 0.784 0.747 0.713 0.681 0.650 0.621 0.593 0.567 0.543 0.519 0.497 0.476 0.456 0.437 0.419 0.402 0.3860 370 0.355 0.341 0.328 5 0.790 0.746 0.705 0.666 0.630 0.596 0.564 0.535 0.507 0.480 0.456 0.432 0.410 0.390 0.370 0.352 0.335 0 319 0.303 0.289 0.275 0.262 0.760 0.711 0.665 0.623 0.583 0.547 0.513 0.482 0.452 0.425 0.400 0.376 0.354 0.333 0.314 0.296 0.279 0.263 0.249 0.2350.2220210 0.731 0.677 0.627 0.582 0.540 0.502 0.467 0.434 0.404 0.376 0.351 0.327 0.305 0.285 0.266 0.249 0.233 0.218 0.204 0.1910.179 0.168 0.703 0.645 0.592 0.544 0.500 0.460 0.424 0.391 0.361 0.333 0.308 0.284 0.263 0.243 0.225 0.209 0.1940.180 0.167 0.15 0.1440434 0.676 0.614 0.558 0.508 0.463 0.422 0.386 0.352 0.322 0.295 0.270 0.247 0.227 0.208 0.191 0.176 0.162 0.149 0.137 0.126 0.116 0.107 EXHIBIT 14B-2 Present Value of an Annuity of Si in Arrears, 0.701 0.645 0.592 0.344 0.500 0.400 0.424 0.391 0.3610-333 0.305 084 0.263 0.243 0.225 6.200 0.194.161.15504134 10 0.676 0,614 0.558 0.508 0.463 0.432 0.386 0.3520,322 0.295 0270 03470.3370.20 0.191 0.176 0.1620149 0.4370.16 0.116 0.16 EXHIBIT 14R.2 Table Summary: Table of present values of an annuity of S1 in areas Periods are listed in best colon. 1-3040 Columns se given for per Present Value of an Alvity of Si in Arrears from 4 percent to 25 percent Periods 696 790 9% 10% 11% 12% 13% 14% 15% 16 17 18%. 194.2046 21% 22% 23% 14% 25% 1 0.962 0.952 0.943 0.933 0.926 0.917 0.909 0.901 0,893 0.885 0.8770.870 0.862 0.855 0.5470.84008330,826 0.0200.813060360 2 1.886 1859 1.833 1.808 1.783 1.759 1.736 1.713 1.690 1668 1.647 1.626 1.605 1.585 1 566 1.5471528 1.509 1.492 LATA LAS71410 3 2.775 2.723 2.673 2.624 3.577 2.531 2.487 2.444 2.402 2.361 2.3222283 2246 2.210 2.174 2.140 2.106 2074 2.042 2011 1.91 1952 + 3.630 3.546 3.465 3.387 3.312 3.240 3.170 3.102 3.037 2.9742914 2.855 2.798 2 743 2.690 2.639 2 589 2.540 2.494 2.448 2.1042.363 3 4.452 4.329 4.212 4.100 3.993 3.890 3.791 3.696 3.605 3.5173.433 3.332 3.274 3.1993.127 3.058 2.991 2.926 2.864 2.803 2.745 2.689 6 5.242 3.076 4.917 4.767 4.623 4.486 4.355 4.231 4.111 3.998 3.889 3.784 3.685 3.589 3.498 3.410 3.326 3245 3.167 3.092 3.0202951 7 6.002 5.786 5.582 5.389 5.206 5.033 4.868 4.712 4.564 4.423 4.288 4.160 4.039 39223.8123.706 3.605 3.508 3416 3327 3.3423.161 8 6.733 6.463 6210 5.971 5.747 5.535 5.335 5.146 4.968 4.799 4.639 4,487 4 344 4.207 4.078 3.954 3.5373.726 3 619 3518 3,421 3.329 9 7.435 7.108 6.802 6.515 6,247 5.995 5.759 3.537 5.328 5.132 4.946 4.772 4.607 4 451 4,303 4.163 4031 3.905 3.786 3,673 3.936 3:46) 10 8.111 7.722 7.360 7.024 6.710 6.418 6.145 5.889 5.650 5.426 5.216 5.019 4833 4,659 4.494 4.3394.192 4,0543923 3.799 3.6823.571 ulu Hypermarket keep the old truck or purchase the new onc? Why? For the toolbar, press ALT+F10 (PC) or ALTHEN F10Mac A T. XO QE Opt Arla Paragraph 33 Et : 1 D EBE * 2 X XT 14 [+ + Question DA and Dive within the same com The home to man devis D A Carbuite ISO Number of stw being sold to outside 150,000 Selling price per unit to dete 573 Vale coste per il Fred cost per based on capacity) 52 IN vision Number of units needed army 20.000 Purchase price now being paid to outside oppler 573 Ashady indicates that Division A can avoid 55 per it wapping costs on my sales to Devision B. Required: Compute the following 1. Calculate the lowest acceptable transfer price for the seller (Division Ay? 2. Calculate the highest acceptable transfer price for the buyer Division By? 2. Calculate the range of acceptable transfer prices between the two divisions? Assume Division A offers to sell 20,000 units to Division it for 572 and that Division B refuses this price. What will be the loss in potential profits for the company whold For the toolba press ALT FOIP) or ALTHFNFO (Mad TVS Paragraph All 100 2TXO QE xx, i } * 12 AM When Wahhhhh NOME EXHIBIT 140-1 Table Summary: Table of prosent values of si. Periods are listed in first column: 1-30 and 4 Columns we given for percuts from percent Present Value of si: 25 percent Periods 496 596 696 7% 8% 9% 10% 11% 12% 13% 14% 15% 16% 17% 18%. 19% 20% 21% 22% 23% 24% 25% 1 0 962 0.952 0.943 0.935 0.926 0.917 0.909 0.901 0.893 0.885 0.8770.870 0.862 0,855 0.8470840 0.8330 8260.820 0.313 010600 2 0.925 0.907 0.890 0.873 0.8570.842 0.826 0.812 0.797 0.783 0.769 0.756 0.743 0.731 0.7180.7060.694 063 0672.06610650 0.640 3 0.889 0.864 0.8-40 0.816 0.794 0.772 0.751 0.731 0.712 0.693 0.675 0.658 0.641 0.624 0,609 0.593 0.5790,564 0.551 0.5370,524 0.512 4 0.855 0.823 0.792 0.763 0.735 0.708 0.683 0.659 0.636 0.613 0.592 0.572 0.552 0.534 0.516 0.499 0482 0.467 0.4510437 0423 0410 5 0.822 0.784 0.747 0.713 0.681 0.650 0.621 0.593 0.567 0.543 0.519 0.497 0.476 0.456 0.437 0.419 0.402 0.3860 370 0.355 0.341 0.328 5 0.790 0.746 0.705 0.666 0.630 0.596 0.564 0.535 0.507 0.480 0.456 0.432 0.410 0.390 0.370 0.352 0.335 0 319 0.303 0.289 0.275 0.262 0.760 0.711 0.665 0.623 0.583 0.547 0.513 0.482 0.452 0.425 0.400 0.376 0.354 0.333 0.314 0.296 0.279 0.263 0.249 0.2350.2220210 0.731 0.677 0.627 0.582 0.540 0.502 0.467 0.434 0.404 0.376 0.351 0.327 0.305 0.285 0.266 0.249 0.233 0.218 0.204 0.1910.179 0.168 0.703 0.645 0.592 0.544 0.500 0.460 0.424 0.391 0.361 0.333 0.308 0.284 0.263 0.243 0.225 0.209 0.1940.180 0.167 0.15 0.1440434 0.676 0.614 0.558 0.508 0.463 0.422 0.386 0.352 0.322 0.295 0.270 0.247 0.227 0.208 0.191 0.176 0.162 0.149 0.137 0.126 0.116 0.107 EXHIBIT 14B-2 Present Value of an Annuity of Si in Arrears, 0.701 0.645 0.592 0.344 0.500 0.400 0.424 0.391 0.3610-333 0.305 084 0.263 0.243 0.225 6.200 0.194.161.15504134 10 0.676 0,614 0.558 0.508 0.463 0.432 0.386 0.3520,322 0.295 0270 03470.3370.20 0.191 0.176 0.1620149 0.4370.16 0.116 0.16 EXHIBIT 14R.2 Table Summary: Table of present values of an annuity of S1 in areas Periods are listed in best colon. 1-3040 Columns se given for per Present Value of an Alvity of Si in Arrears from 4 percent to 25 percent Periods 696 790 9% 10% 11% 12% 13% 14% 15% 16 17 18%. 194.2046 21% 22% 23% 14% 25% 1 0.962 0.952 0.943 0.933 0.926 0.917 0.909 0.901 0,893 0.885 0.8770.870 0.862 0.855 0.5470.84008330,826 0.0200.813060360 2 1.886 1859 1.833 1.808 1.783 1.759 1.736 1.713 1.690 1668 1.647 1.626 1.605 1.585 1 566 1.5471528 1.509 1.492 LATA LAS71410 3 2.775 2.723 2.673 2.624 3.577 2.531 2.487 2.444 2.402 2.361 2.3222283 2246 2.210 2.174 2.140 2.106 2074 2.042 2011 1.91 1952 + 3.630 3.546 3.465 3.387 3.312 3.240 3.170 3.102 3.037 2.9742914 2.855 2.798 2 743 2.690 2.639 2 589 2.540 2.494 2.448 2.1042.363 3 4.452 4.329 4.212 4.100 3.993 3.890 3.791 3.696 3.605 3.5173.433 3.332 3.274 3.1993.127 3.058 2.991 2.926 2.864 2.803 2.745 2.689 6 5.242 3.076 4.917 4.767 4.623 4.486 4.355 4.231 4.111 3.998 3.889 3.784 3.685 3.589 3.498 3.410 3.326 3245 3.167 3.092 3.0202951 7 6.002 5.786 5.582 5.389 5.206 5.033 4.868 4.712 4.564 4.423 4.288 4.160 4.039 39223.8123.706 3.605 3.508 3416 3327 3.3423.161 8 6.733 6.463 6210 5.971 5.747 5.535 5.335 5.146 4.968 4.799 4.639 4,487 4 344 4.207 4.078 3.954 3.5373.726 3 619 3518 3,421 3.329 9 7.435 7.108 6.802 6.515 6,247 5.995 5.759 3.537 5.328 5.132 4.946 4.772 4.607 4 451 4,303 4.163 4031 3.905 3.786 3,673 3.936 3:46) 10 8.111 7.722 7.360 7.024 6.710 6.418 6.145 5.889 5.650 5.426 5.216 5.019 4833 4,659 4.494 4.3394.192 4,0543923 3.799 3.6823.571 ulu Hypermarket keep the old truck or purchase the new onc? Why? For the toolbar, press ALT+F10 (PC) or ALTHEN F10Mac A T. XO QE Opt Arla Paragraph 33 Et : 1 D EBE * 2 X XT 14 [+ +
Step by Step Solution
There are 3 Steps involved in it

Get step-by-step solutions from verified subject matter experts