

Question: f(b] Verify the given sums Ex, Zy, Ex , Ey , Exy, and the value of the sample correlation coefficient r. (Round your value for
![\f(b] Verify the given sums Ex, Zy, Ex , Ey ,](https://s3.amazonaws.com/si.experts.images/answers/2024/06/6674b61bb1482_8276674b61b9abfe.jpg)
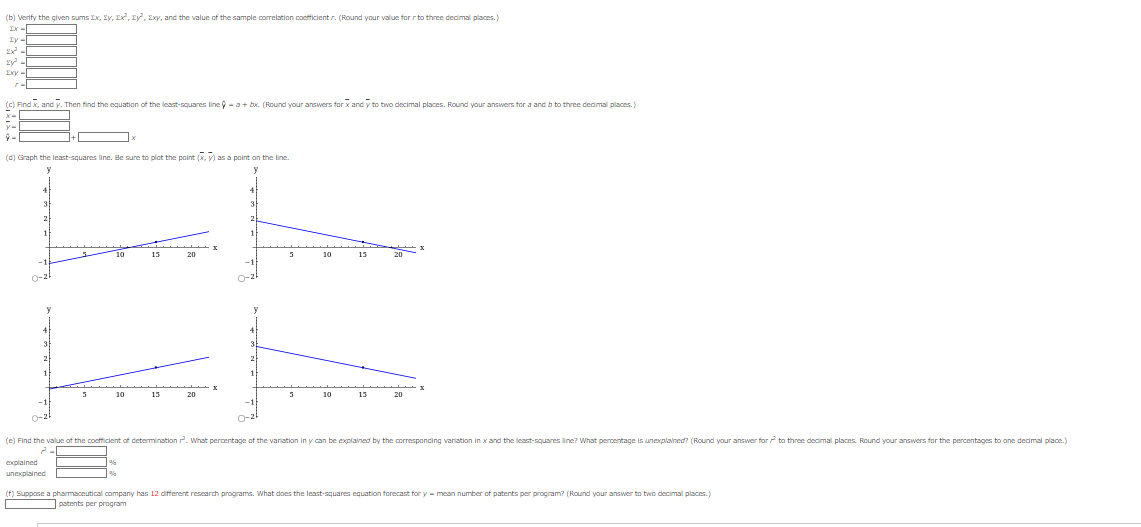
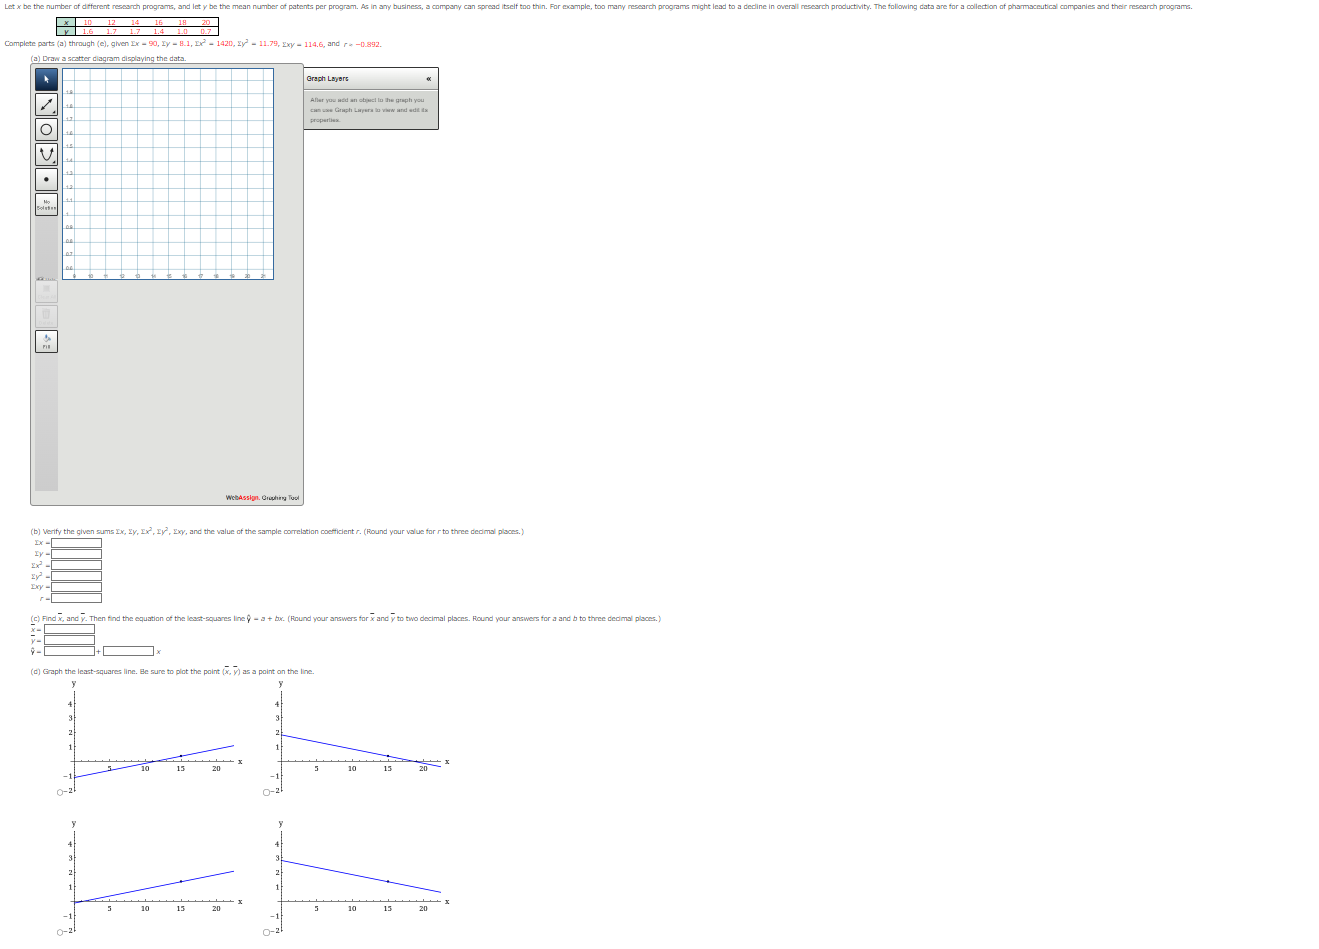

\f(b] Verify the given sums Ex, Zy, Ex , Ey , Exy, and the value of the sample correlation coefficient r. (Round your value for r to three decimal places. ) Ty Ex zy EXY (c) Find x, and y. Then find the equation of the least-squares line ? - a + box. (Found your answers for x and y to two decimal places. Round your answers for a and b to three decimal places. ) (d) Graph the least-squares line. Be sure to plot the point (x, y) as a point on the line. 10 15 20 5 10 15 20 O-2 - X 10 15 20 15 20 (e) Find the value of the coefficient of determination r. What percentage of the variation in y can be explained by the corresponding variation in x and the least-squares line? What percentage is unexplained? (Round your answer for / to three decimal places. Round your answers for the percentages to one dedmal place.) explained unexplained (f) Suppose a pharmaceutical company has 12 different research programs. What does the least-squares equation forecast for y - mean number of patents per program? (Round your answer to two decimal places.) patents per program
Step by Step Solution
There are 3 Steps involved in it

Get step-by-step solutions from verified subject matter experts