

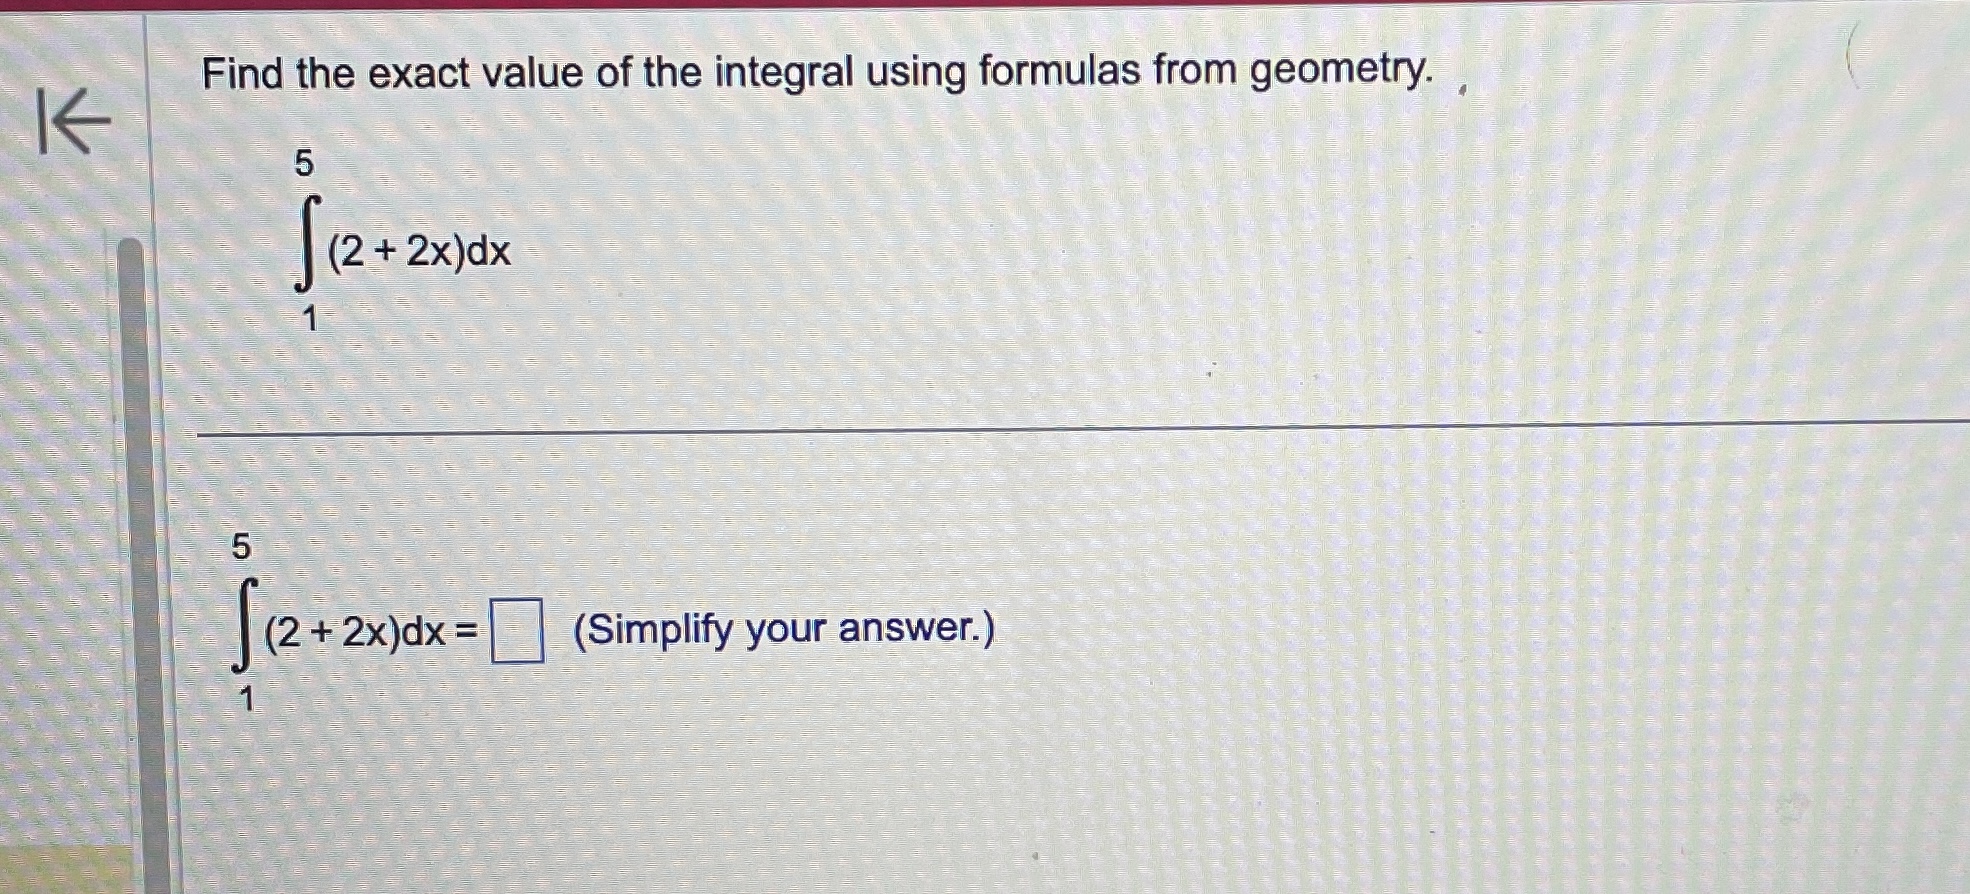
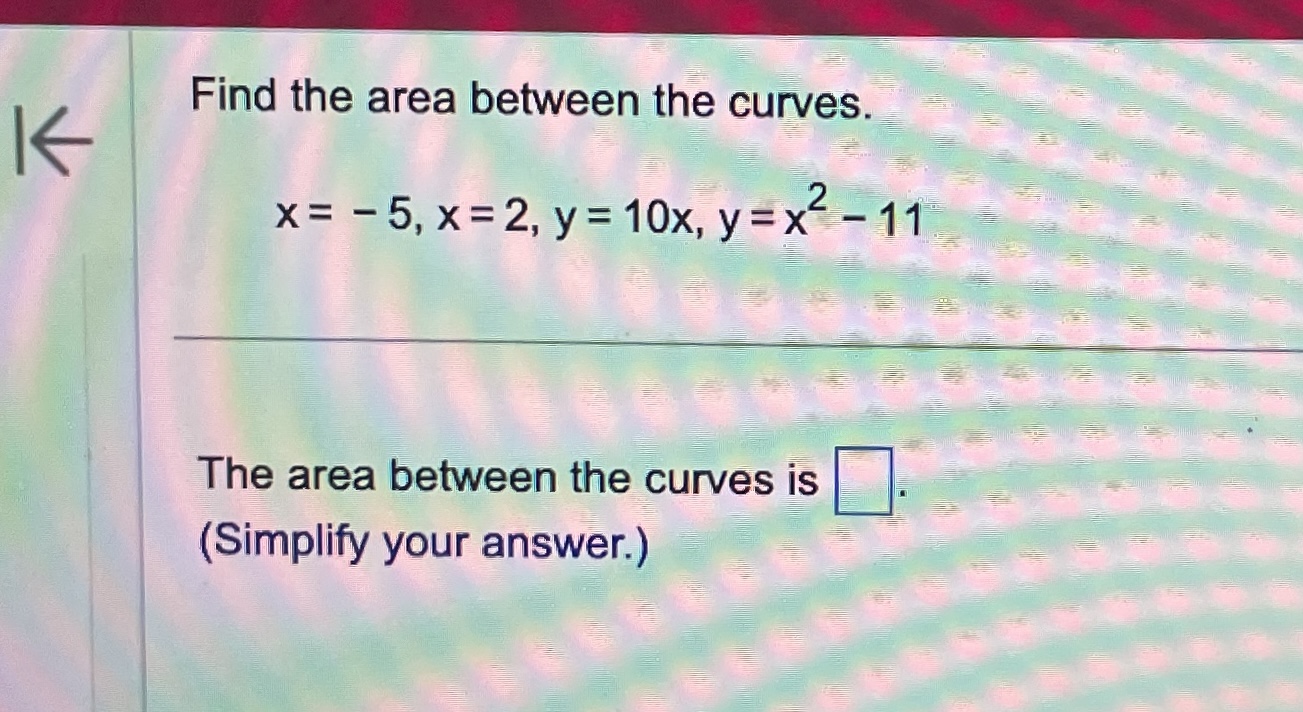
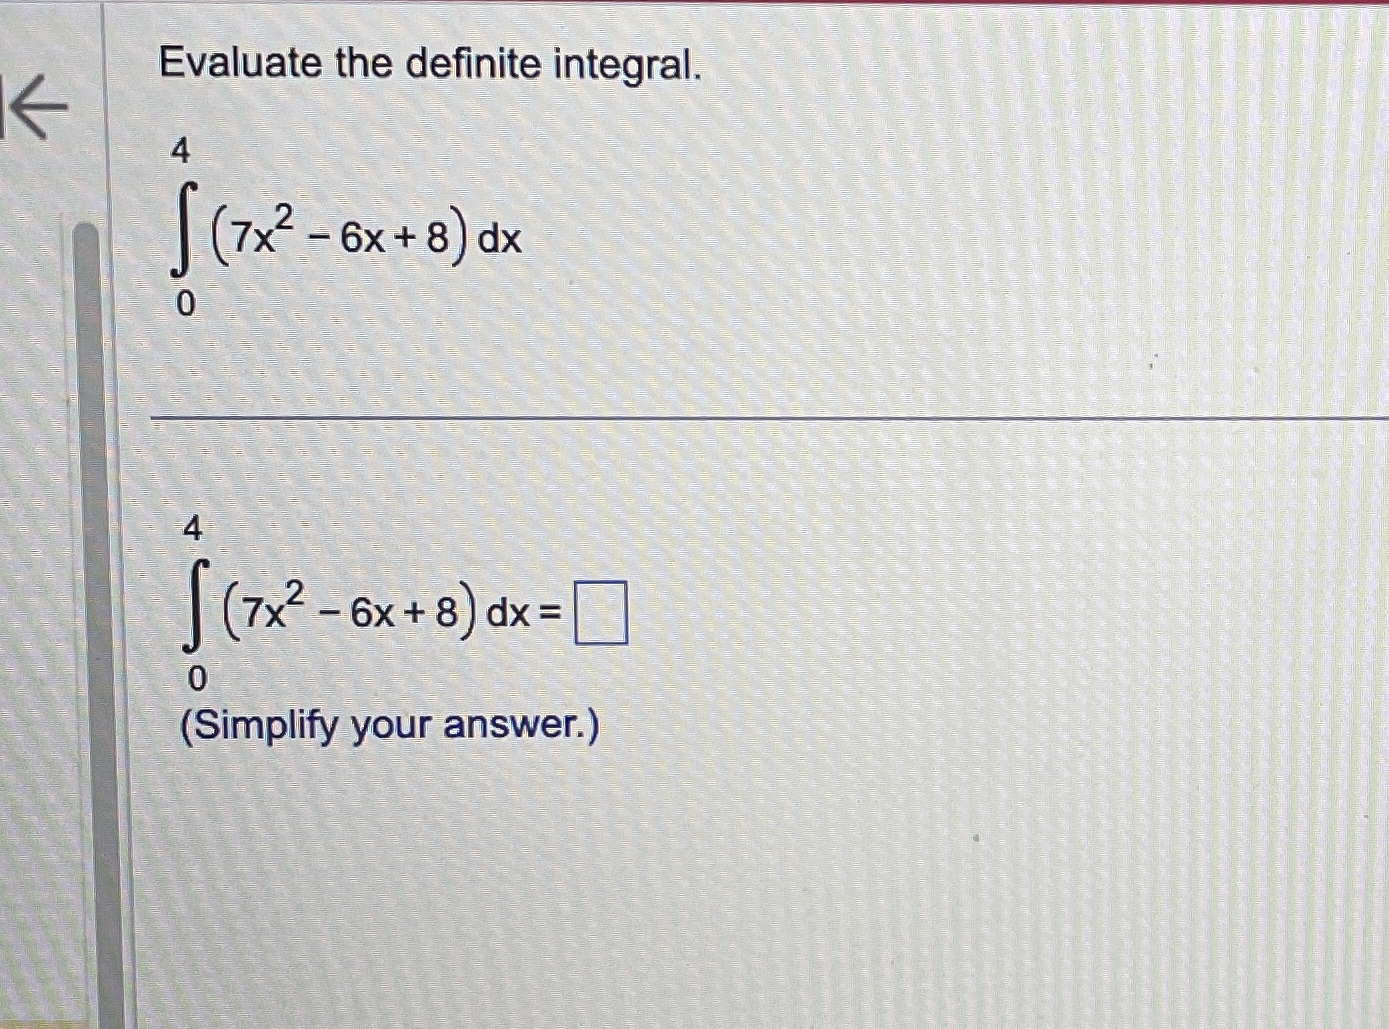
Question: fEvaluate the definite integral. (7X2 - 6x + 8) dx 0 (7X2 - 6X +8) dx = 0 (Simplify your answer.)Use the definite integral to


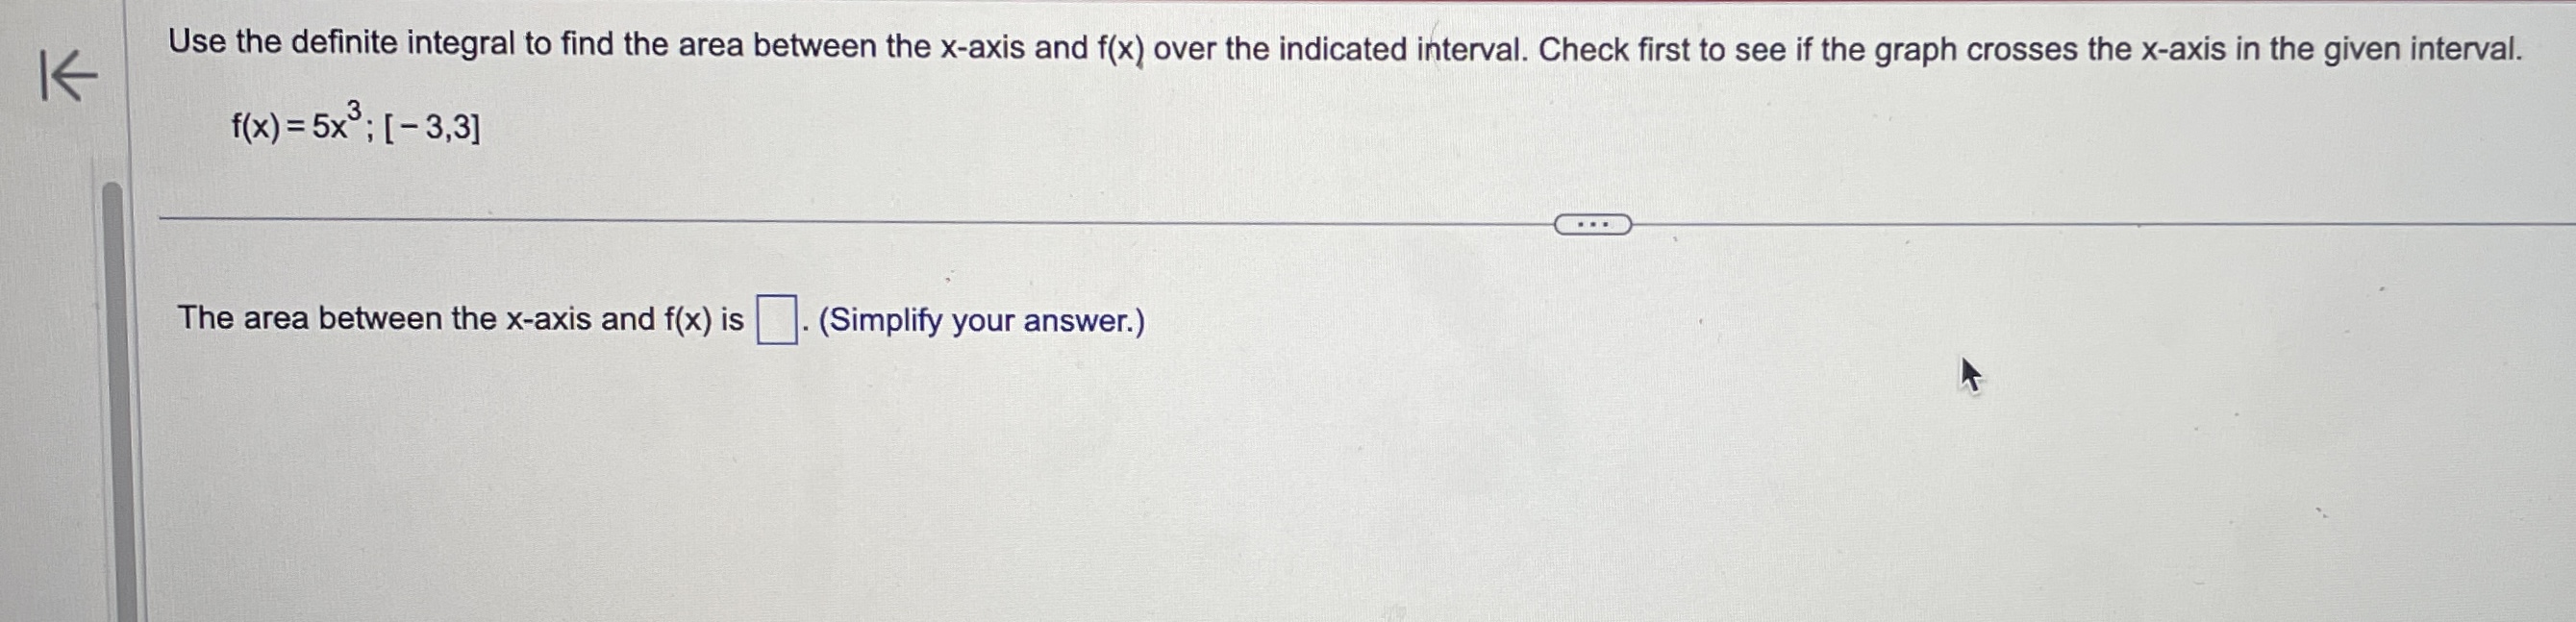
![[ -3, 3] . . . The area between the x-axis and](https://s3.amazonaws.com/si.experts.images/answers/2024/06/6665ee59651d2_1856665ee59441ce.jpg)

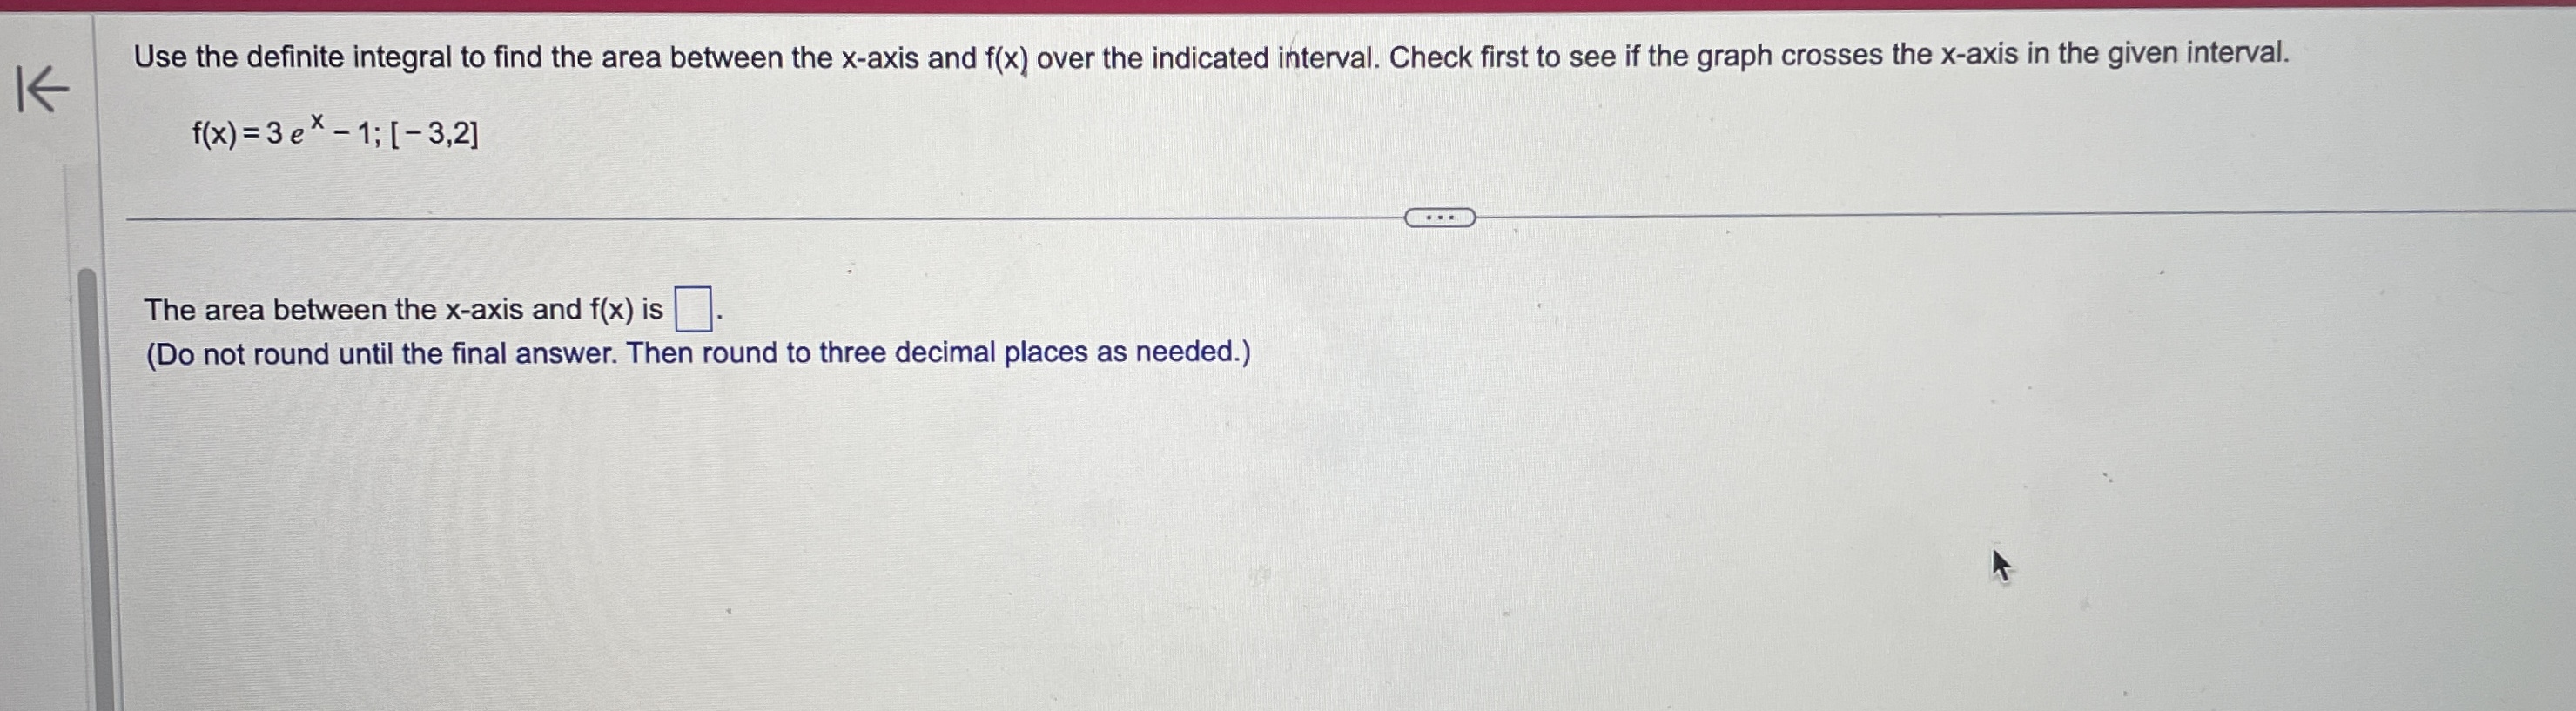
![interval. f(x) =3ex - 1; [-3,2] The area between the x-axis and](https://s3.amazonaws.com/si.experts.images/answers/2024/06/6665ee5b48beb_1876665ee5b27f82.jpg)


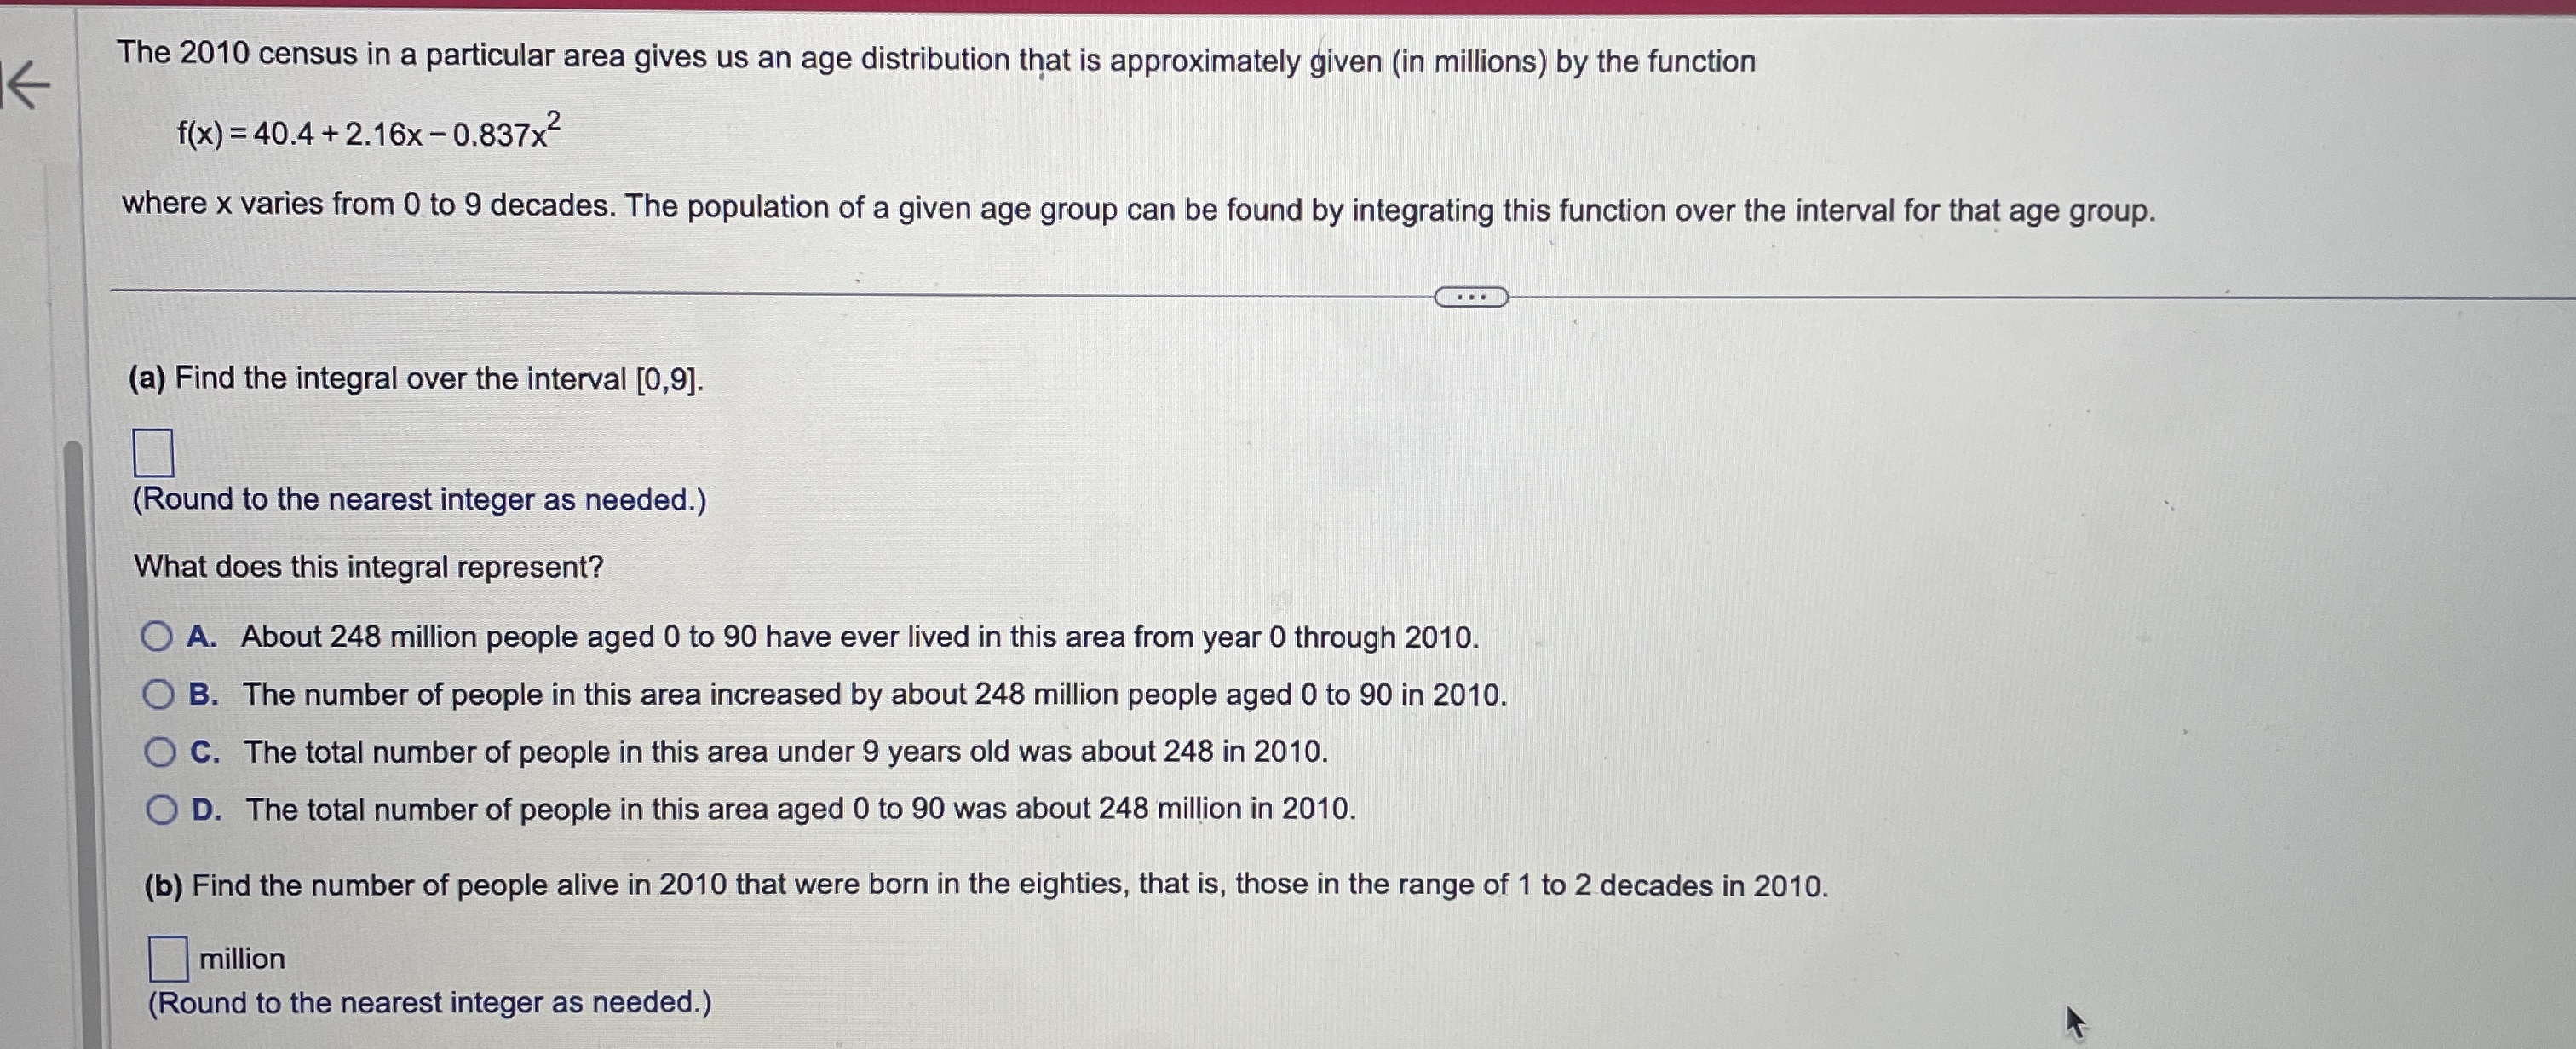
![integral over the interval [0,9]. (Round to the nearest integer as needed.)](https://s3.amazonaws.com/si.experts.images/answers/2024/06/6665ee5fe5fd0_1916665ee5fc81b9.jpg)
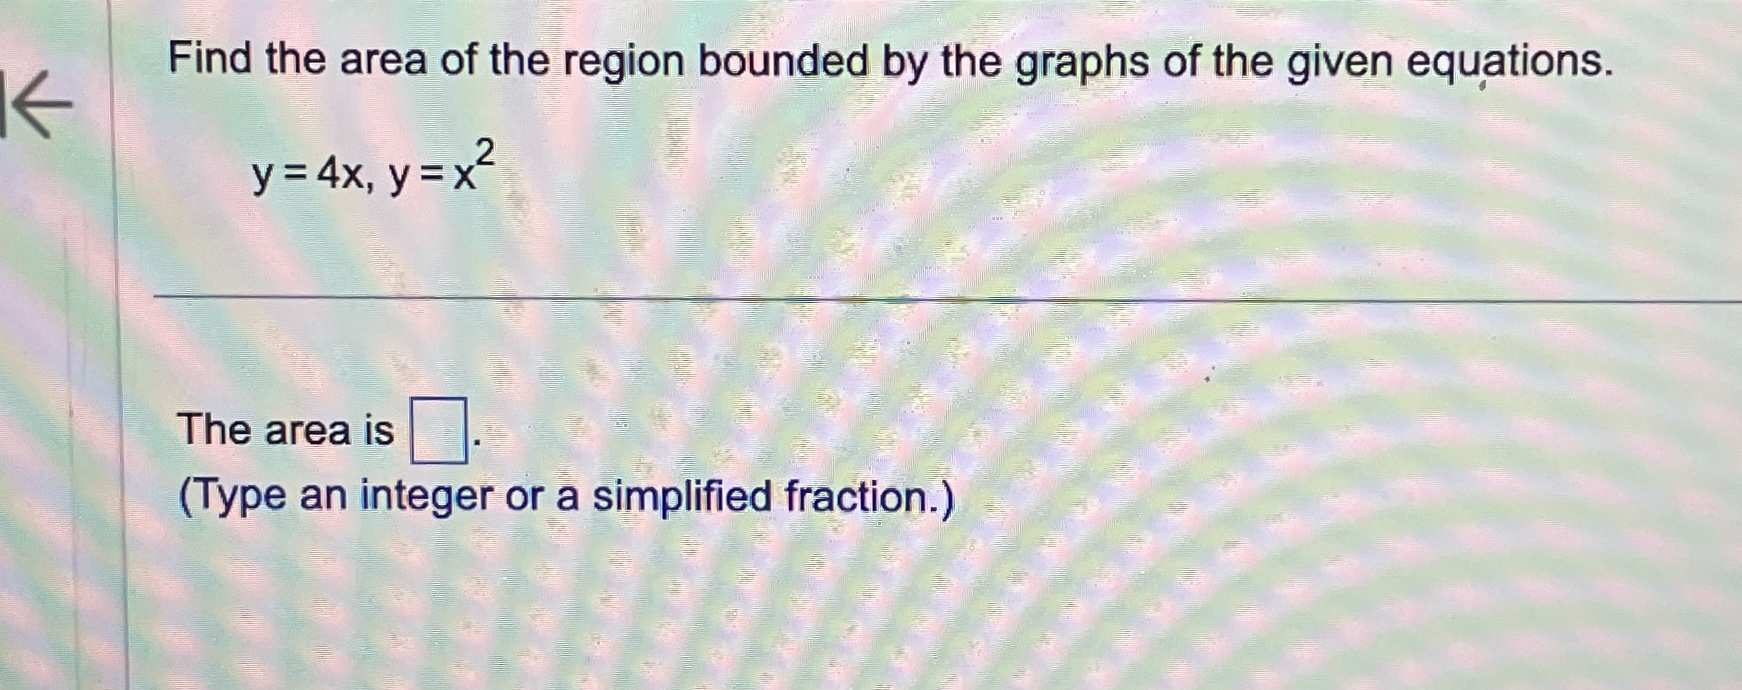
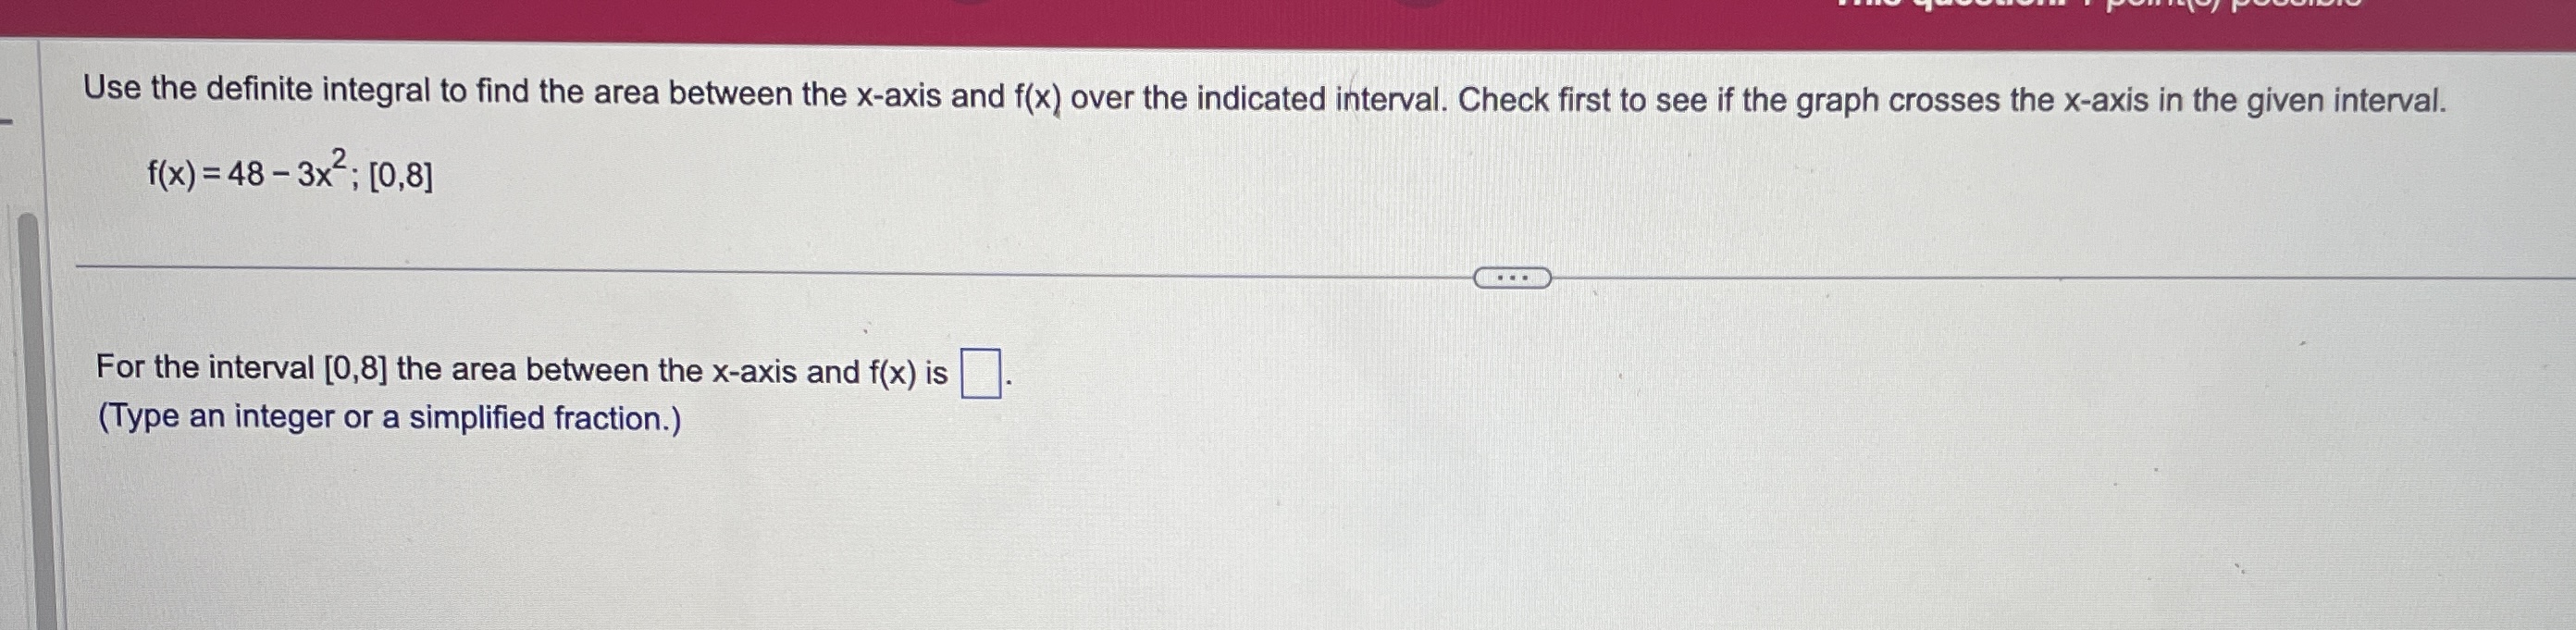
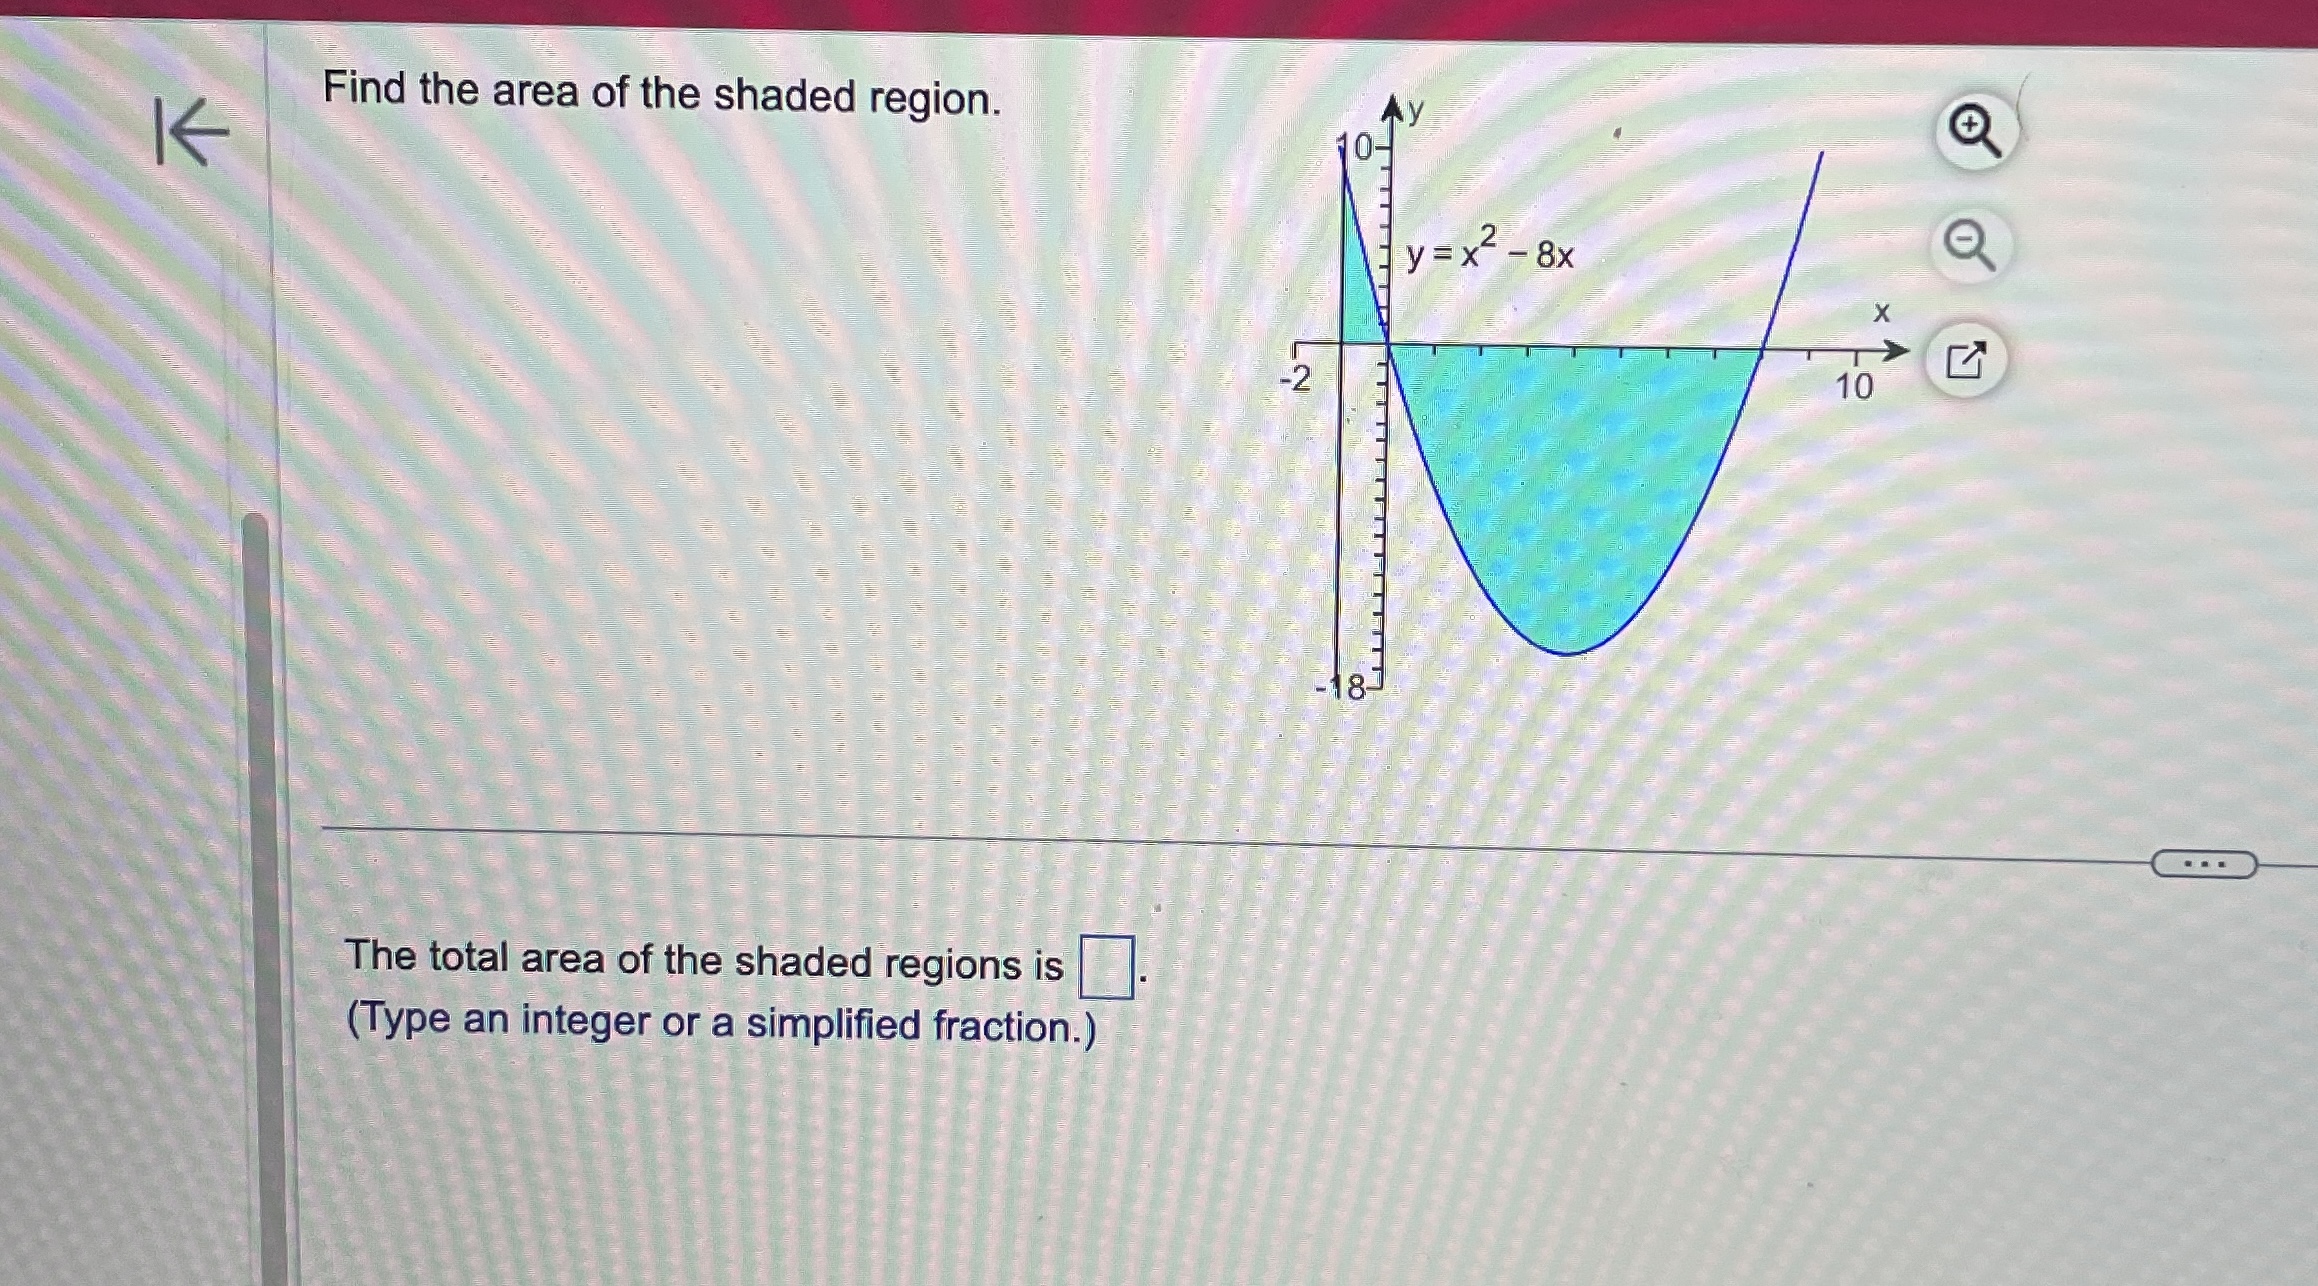
\fEvaluate the definite integral. (7X2 - 6x + 8) dx 0 (7X2 - 6X +8) dx = 0 (Simplify your answer.)Use the definite integral to find the area between the x-axis and f(x) over the indicated interval. Check first to see if the graph crosses the x-axis in the given interval. K f ( x ) = 5x ; [ -3, 3] . . . The area between the x-axis and f(x) is (Simplify your answer.) KK Use the definite integral to find the area between the x-axis and f(x) over the indicated interval. Check first to see if the graph crosses the x-axis in the given interval. f(x) =3ex - 1; [-3,2] The area between the x-axis and f(x) is. (Do not round until the final answer. Then round to three decimal places as needed.)Find the area of the shaded region. + K 0- y=x- 8x X -2 10 . . . The total area of the shaded regions is (Type an integer or a simplified fraction.)The 2010 census in a particular area gives us an age distribution that is approximately given (in millions) by the function f(x) = 40.4 + 2.16x - 0.837x2 where x varies from 0 to 9 decades. The population of a given age group can be found by integrating this function over the interval for that age group. (a) Find the integral over the interval [0,9]. (Round to the nearest integer as needed.) What does this integral represent? O A. About 248 million people aged 0 to 90 have ever lived in this area from year 0 through 2010. O B. The number of people in this area increased by about 248 million people aged 0 to 90 in 2010. O C. The total number of people in this area under 9 years old was about 248 in 2010. O D. The total number of people in this area aged 0 to 90 was about 248 million in 2010. (b) Find the number of people alive in 2010 that were born in the eighties, that is, those in the range of 1 to 2 decades in 2010. million (Round to the nearest integer as needed.)Find the area between the curves. K x = - 5, x = 2, y = 10x, y =x - 11 The area between the curves is (Simplify your answer.)Find the area of the region bounded by the graphs of the given equations. y = 4x, y= x2 The area is (Type an integer or a simplified fraction.)
Step by Step Solution
There are 3 Steps involved in it

Get step-by-step solutions from verified subject matter experts