

Question: - Select your answer - V b. What does the scatter diagram indicate about the relationship between the two variables? There appears to be a
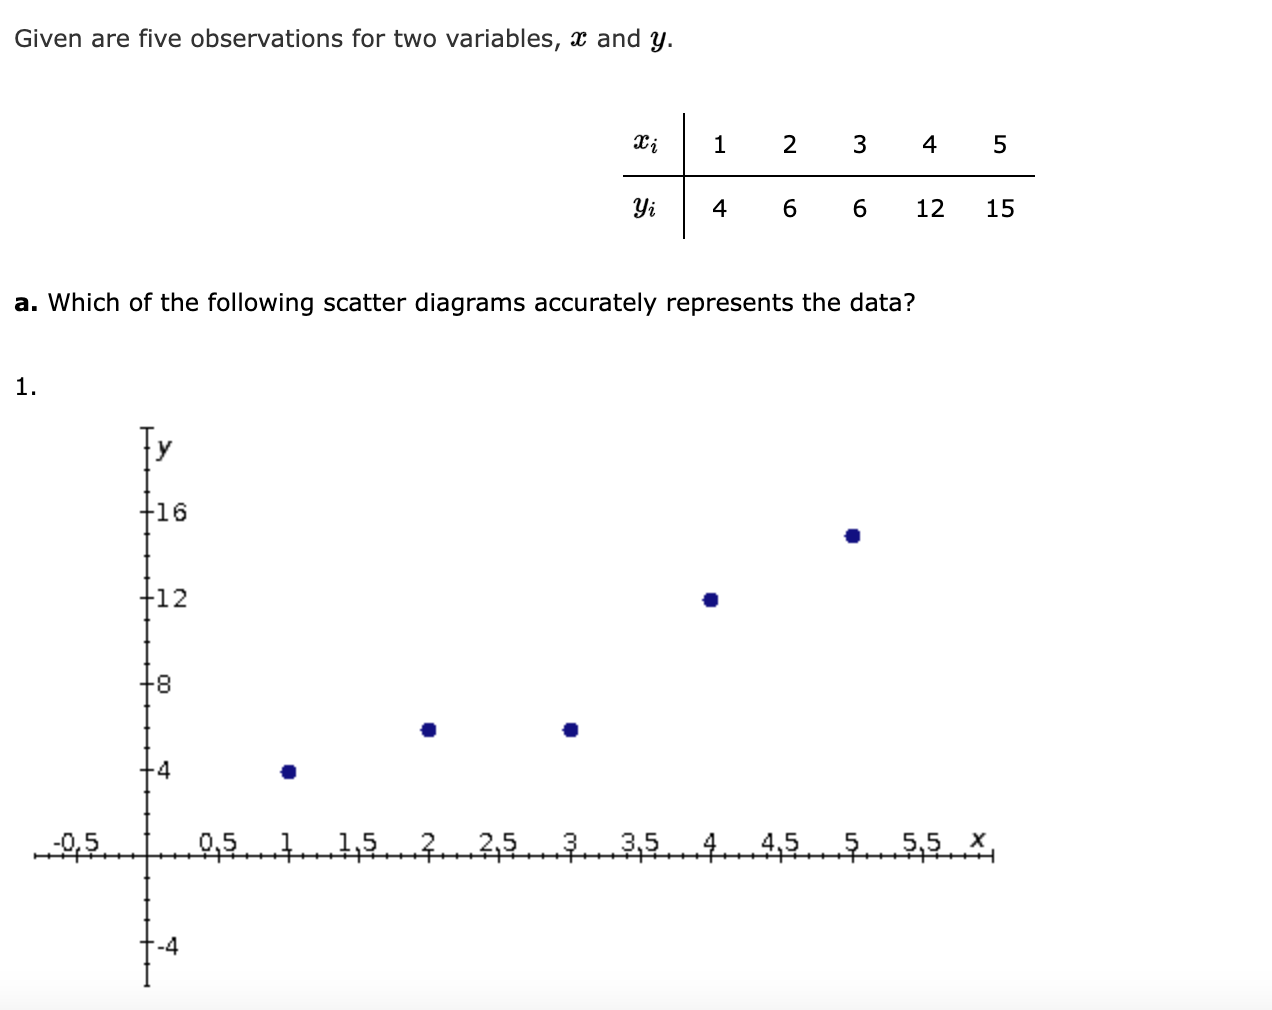
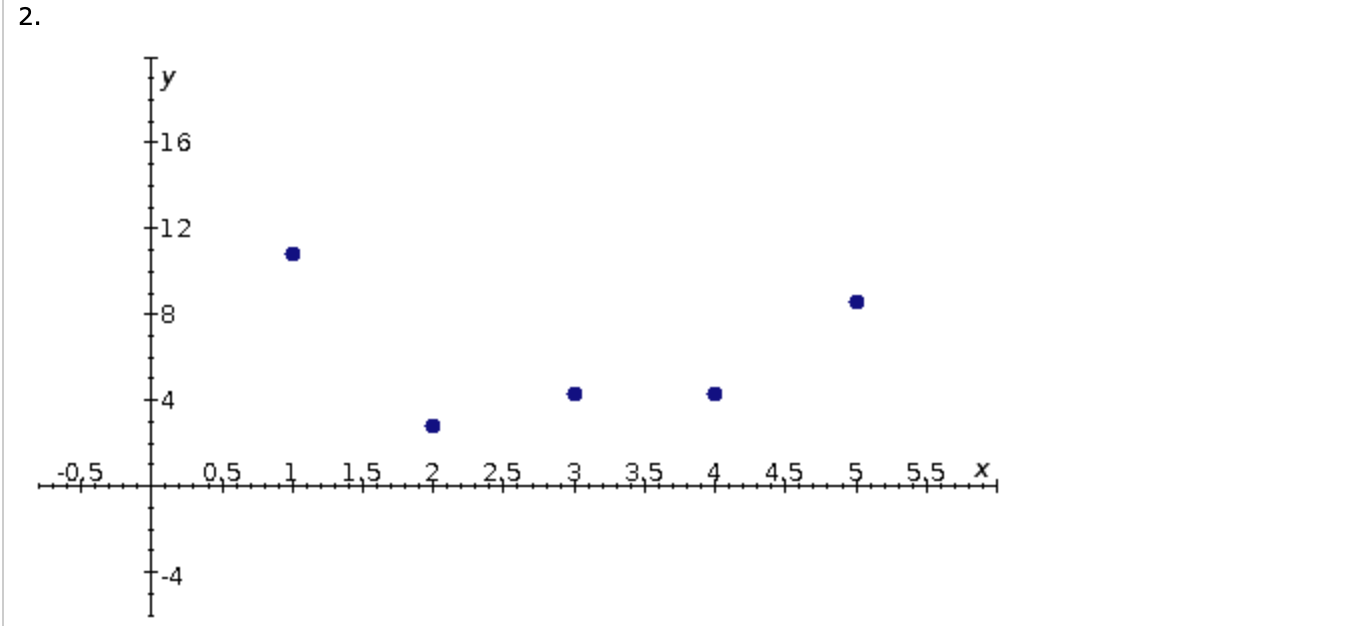
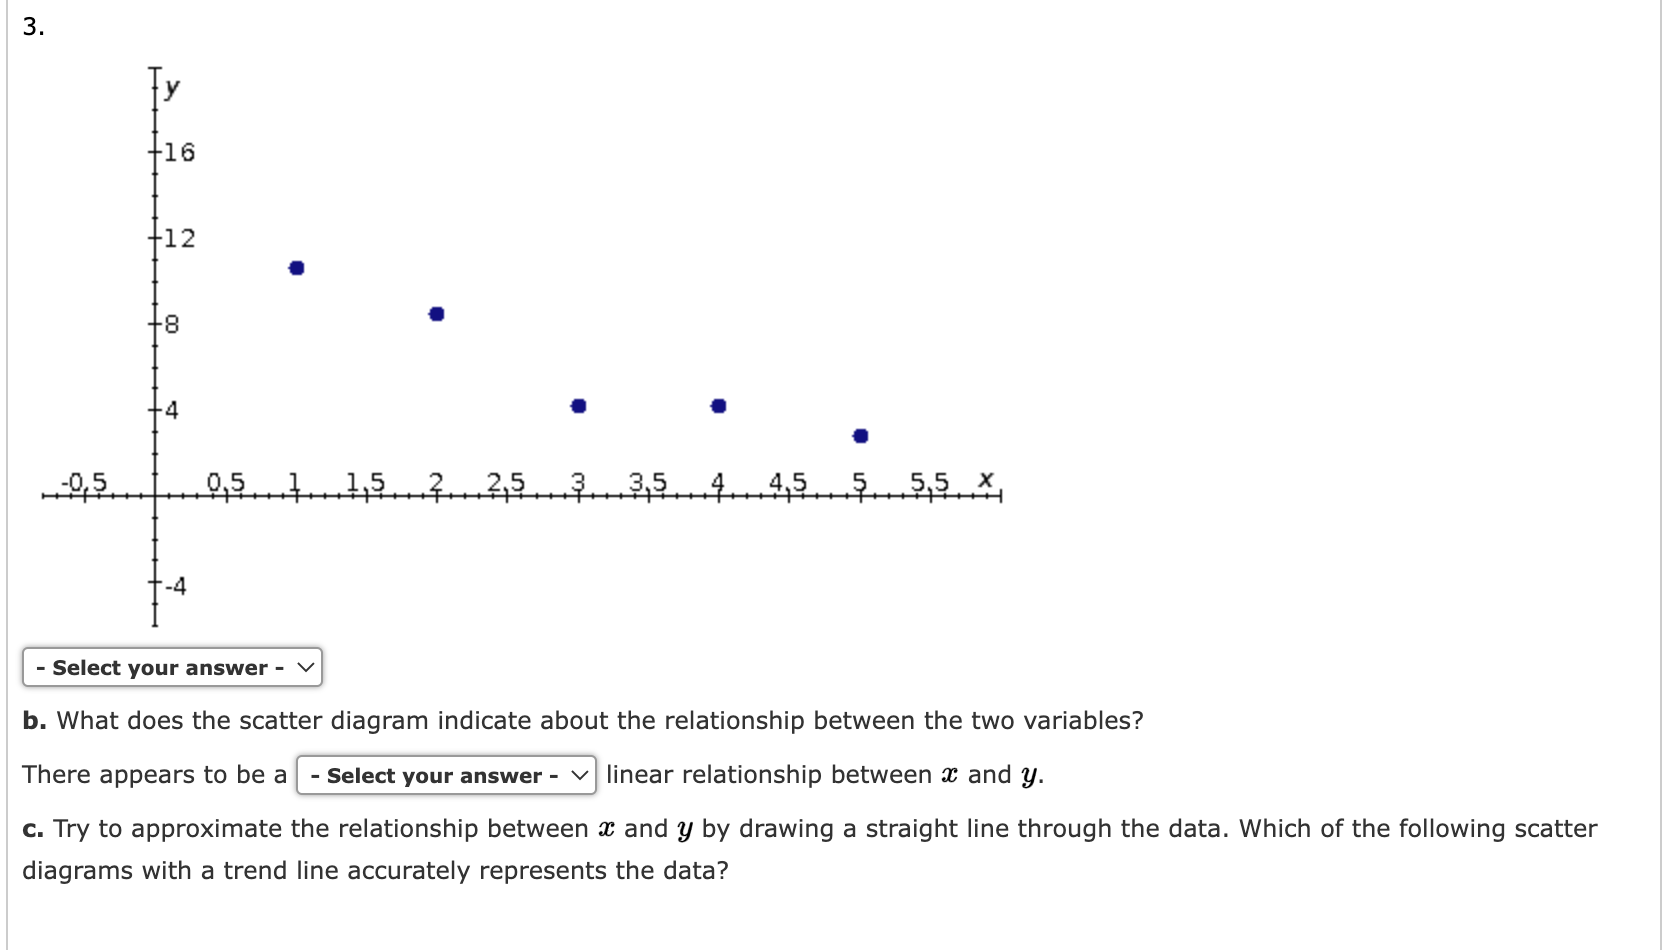
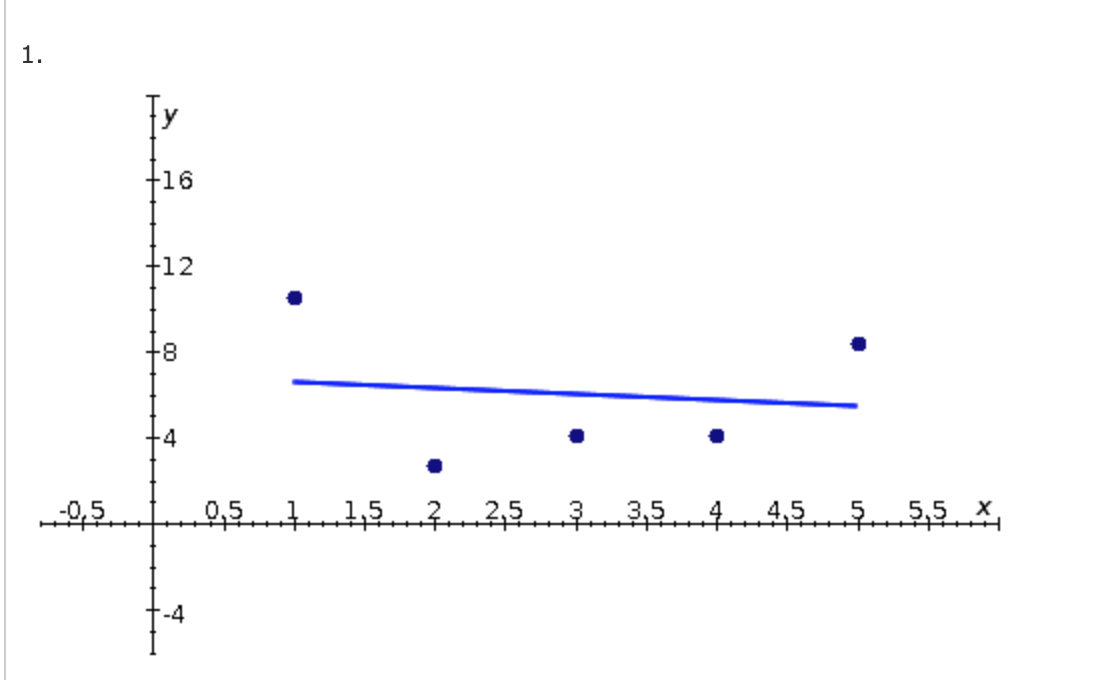
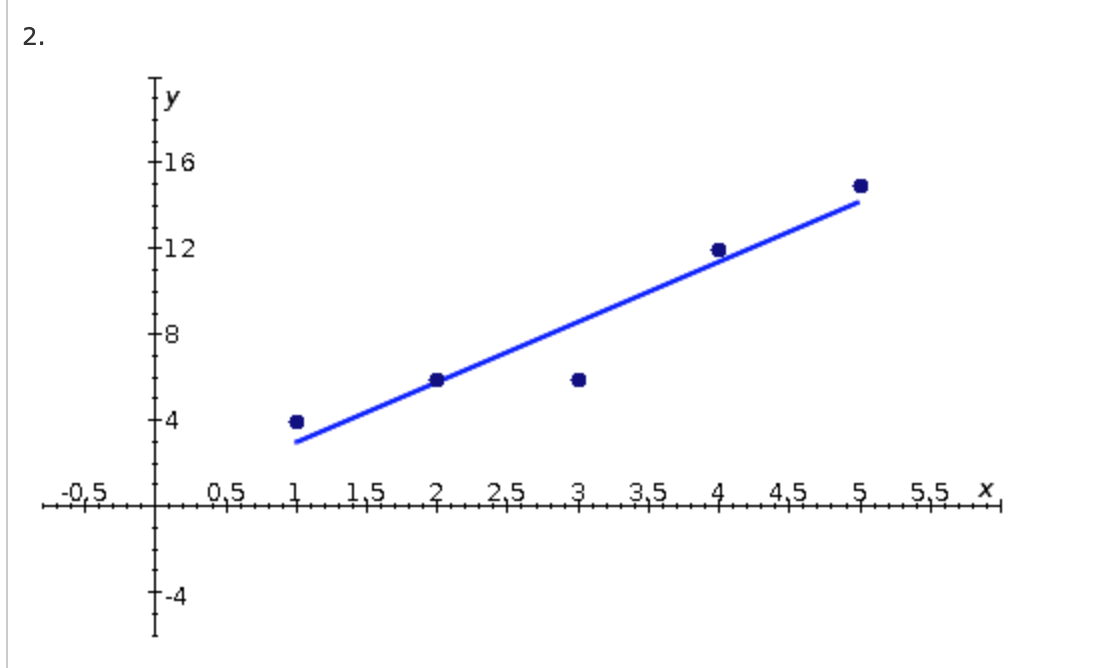
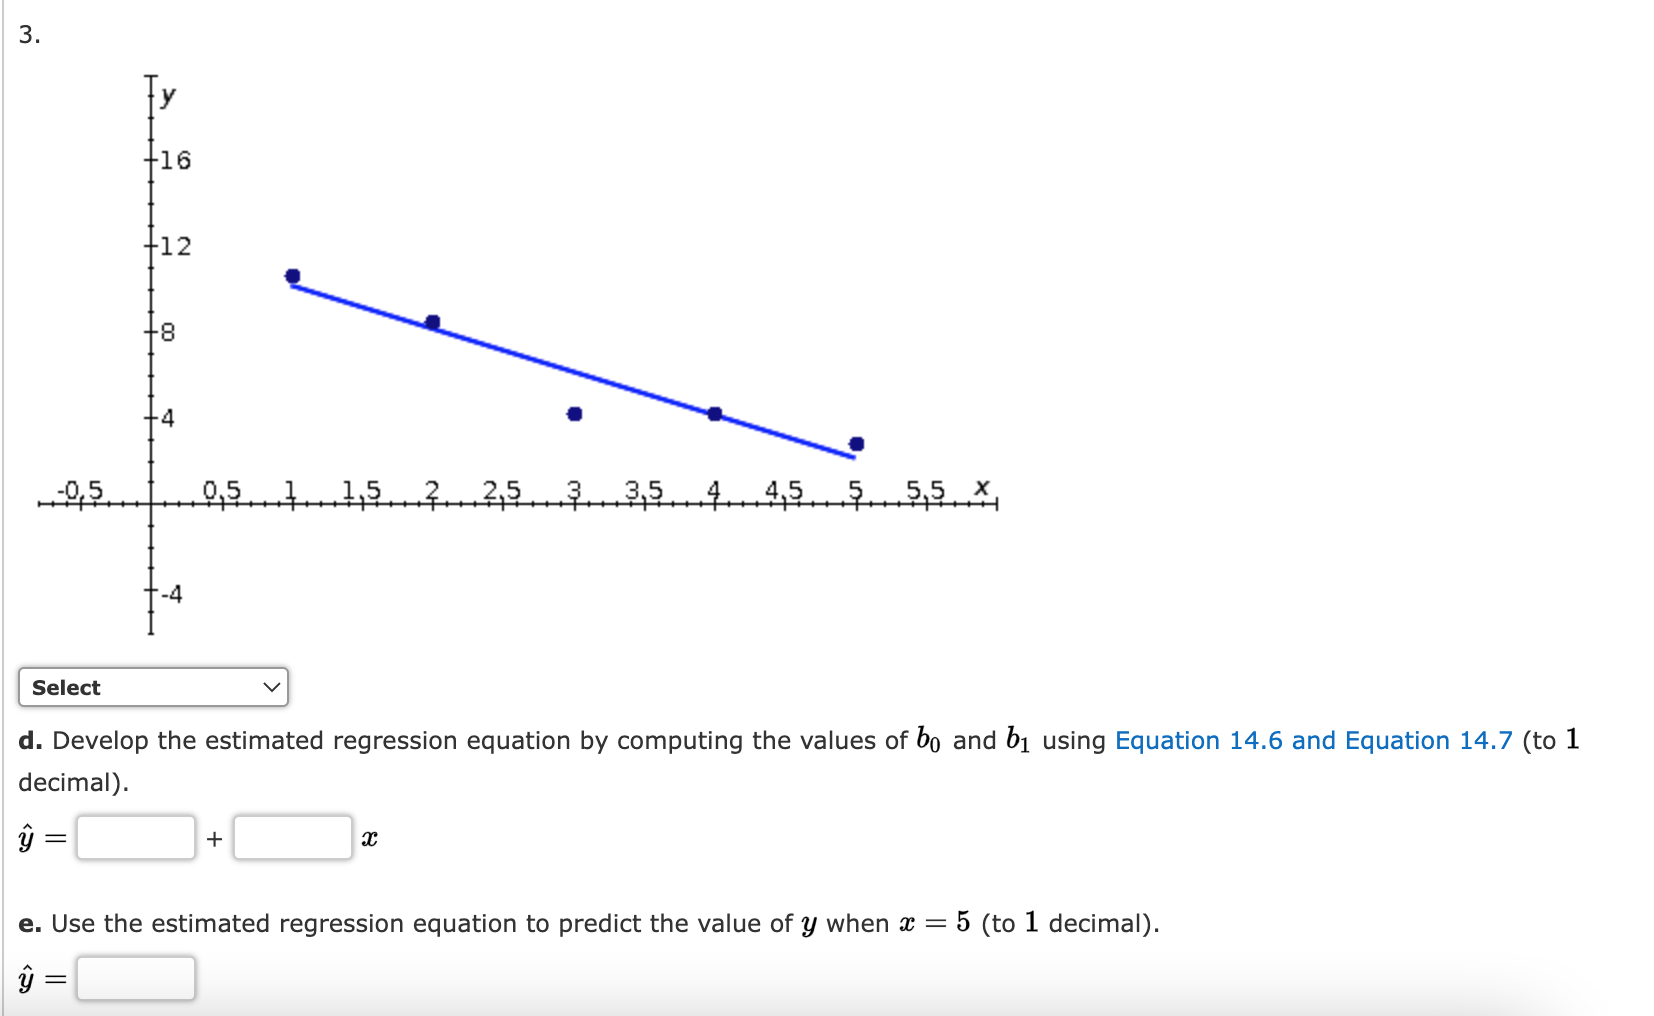
- Select your answer - V b. What does the scatter diagram indicate about the relationship between the two variables? There appears to be a linear relationship between a: and y. c. Try to approximate the relationship between :1: and y by drawing a straight line through the data. Which of the following scatter diagrams with a trend line accurately represents the data? 1. +16 +12 +8 +4 -05.1 05 1 15 3 25 3 35 9 45 5 55 X +-4\fd. Develop the estimated regression equation by computing the values of be and In using Equation 14.6 and Equation 14.7 (to 1 decimal). \"2) H + 5-3 e. Use the estimated regression equation to predict the value of y when x = 5 (to 1 decimal). c'-'3> ||
Step by Step Solution
There are 3 Steps involved in it

Get step-by-step solutions from verified subject matter experts