

Question: ff31. Find and interpret the linear correlation for the data from problem 23: X A 6 7 D 10 437 901 1155 1358 1768 2103
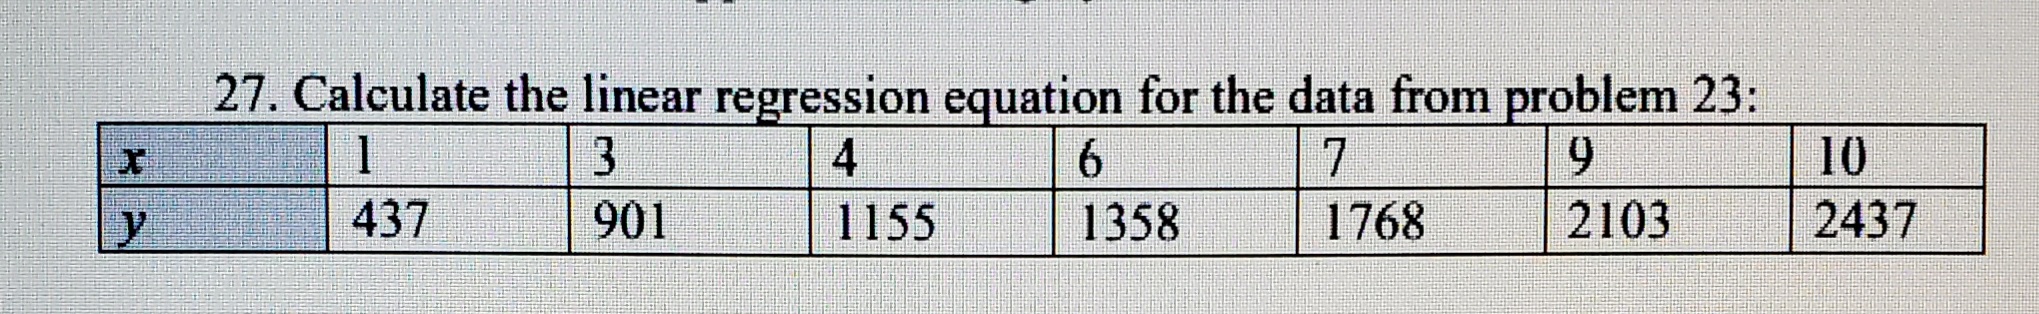
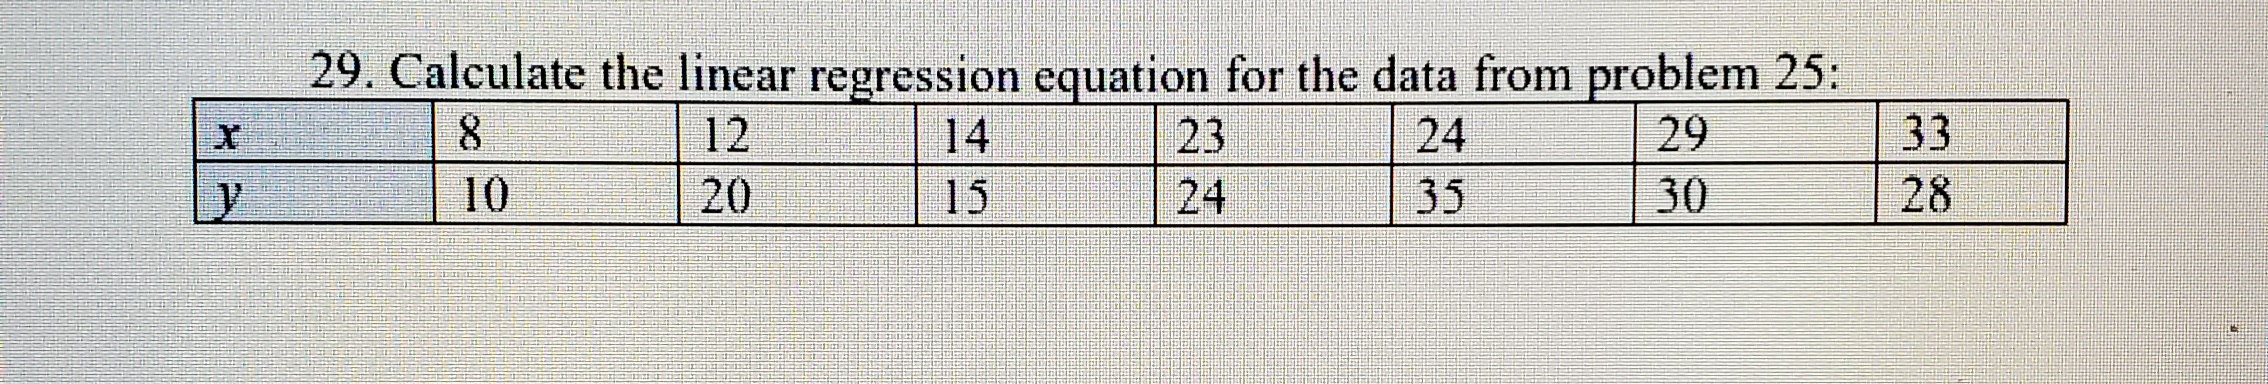
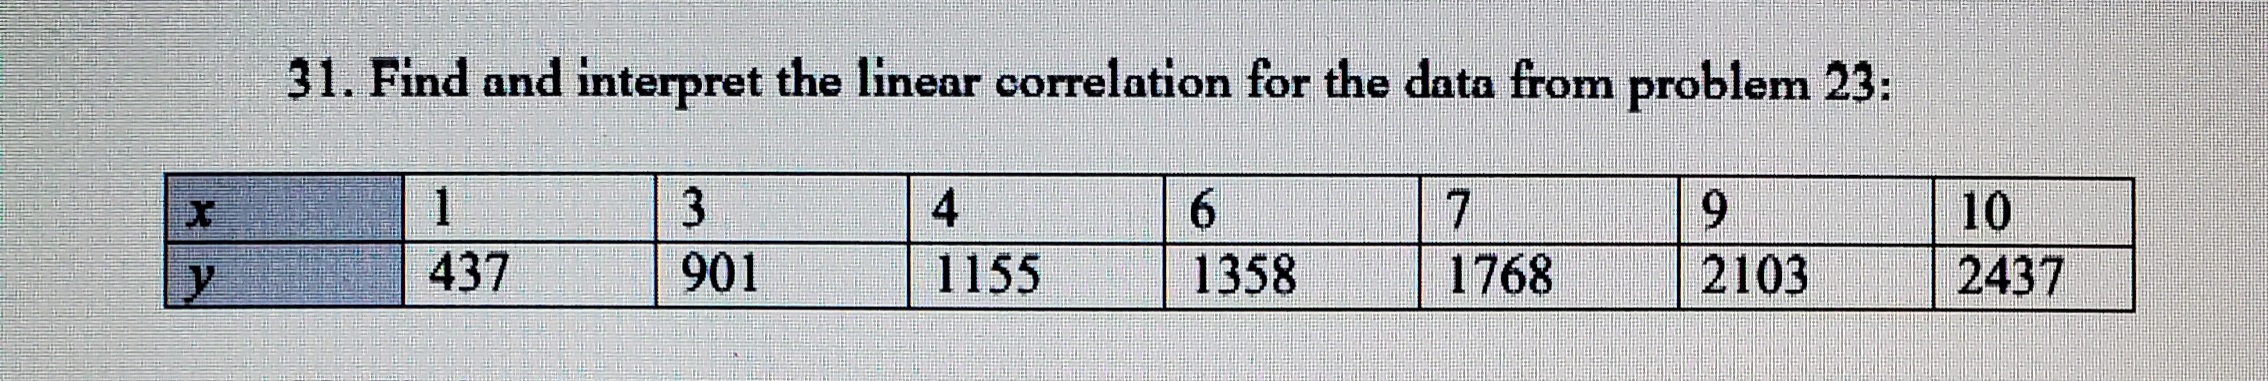
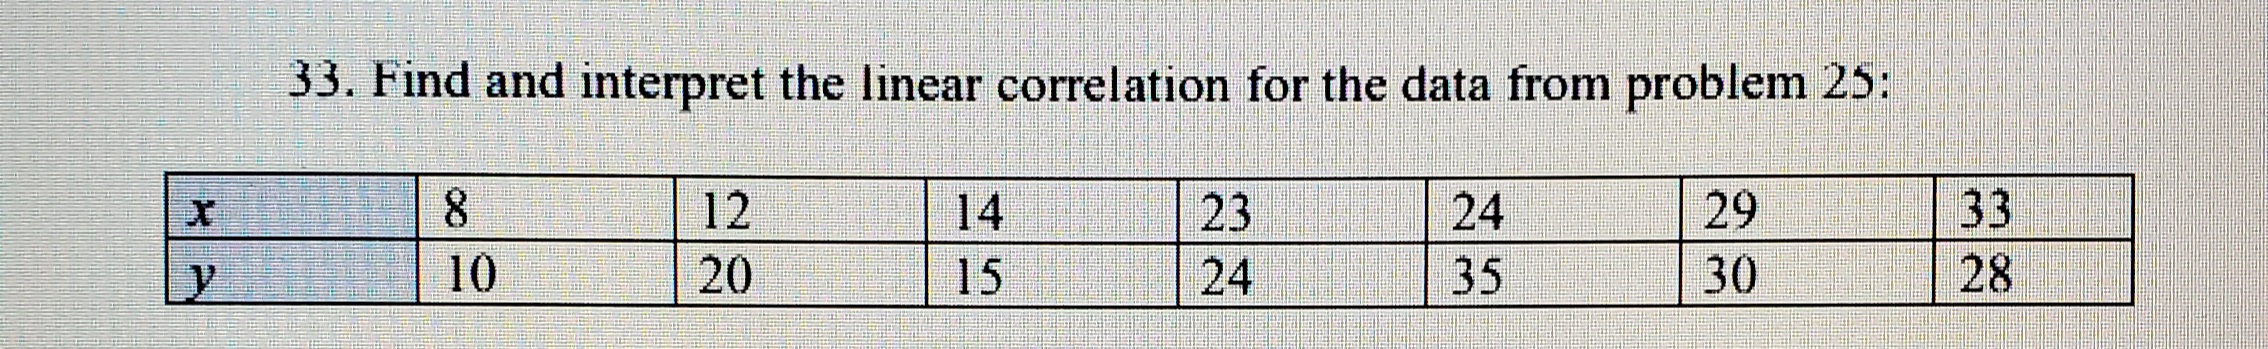
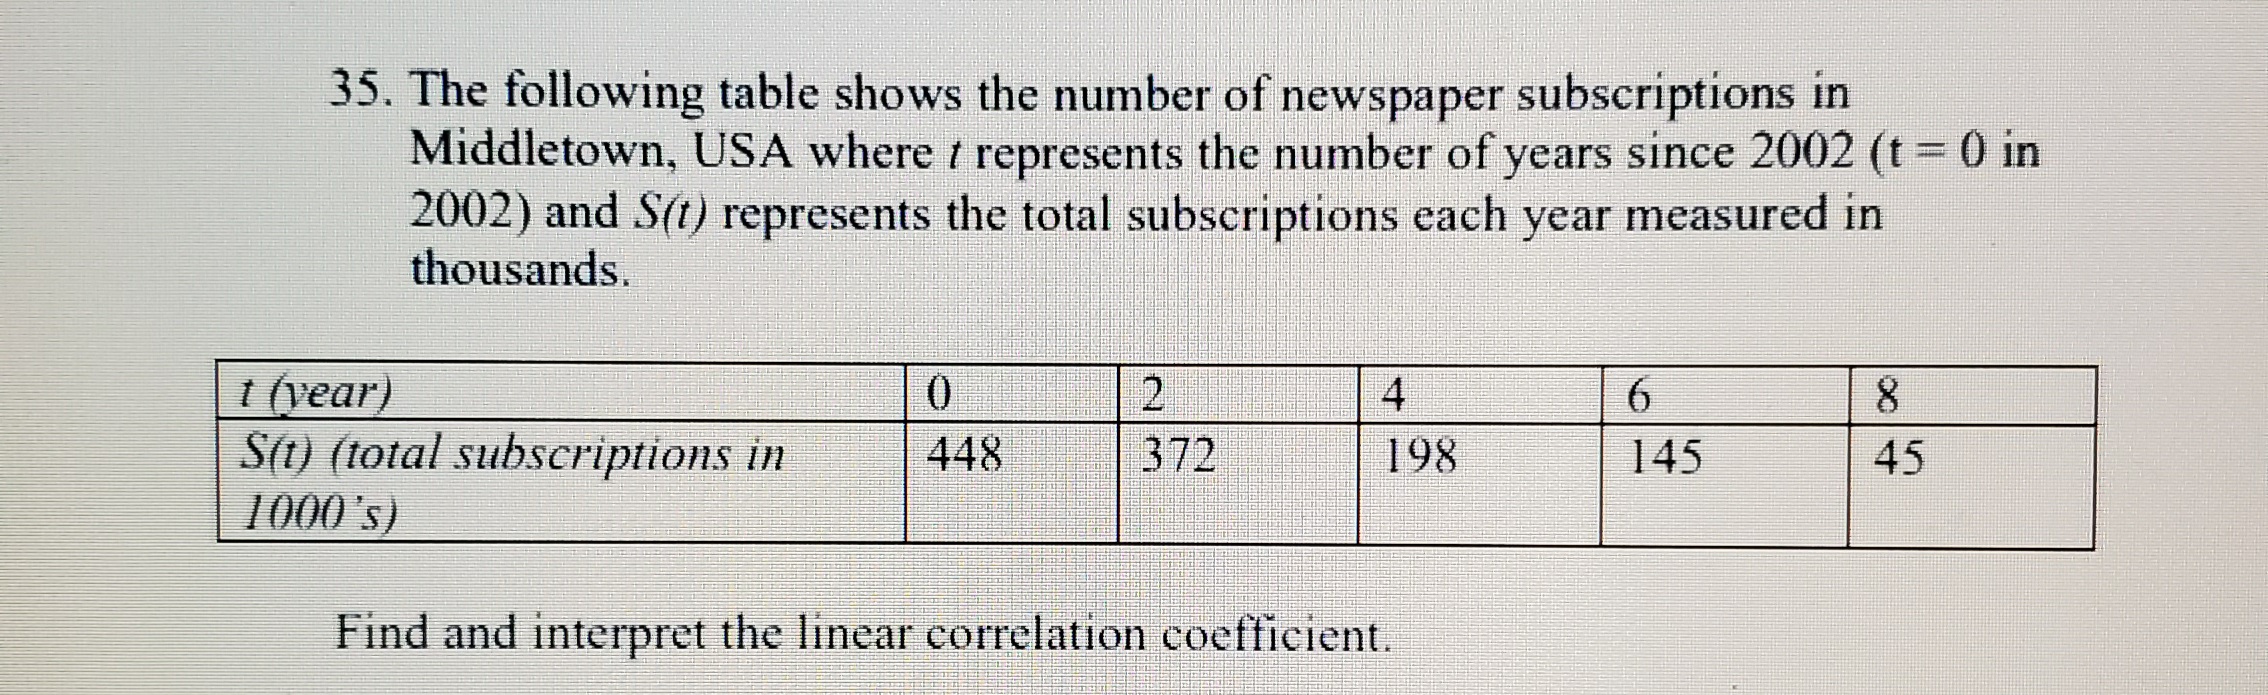

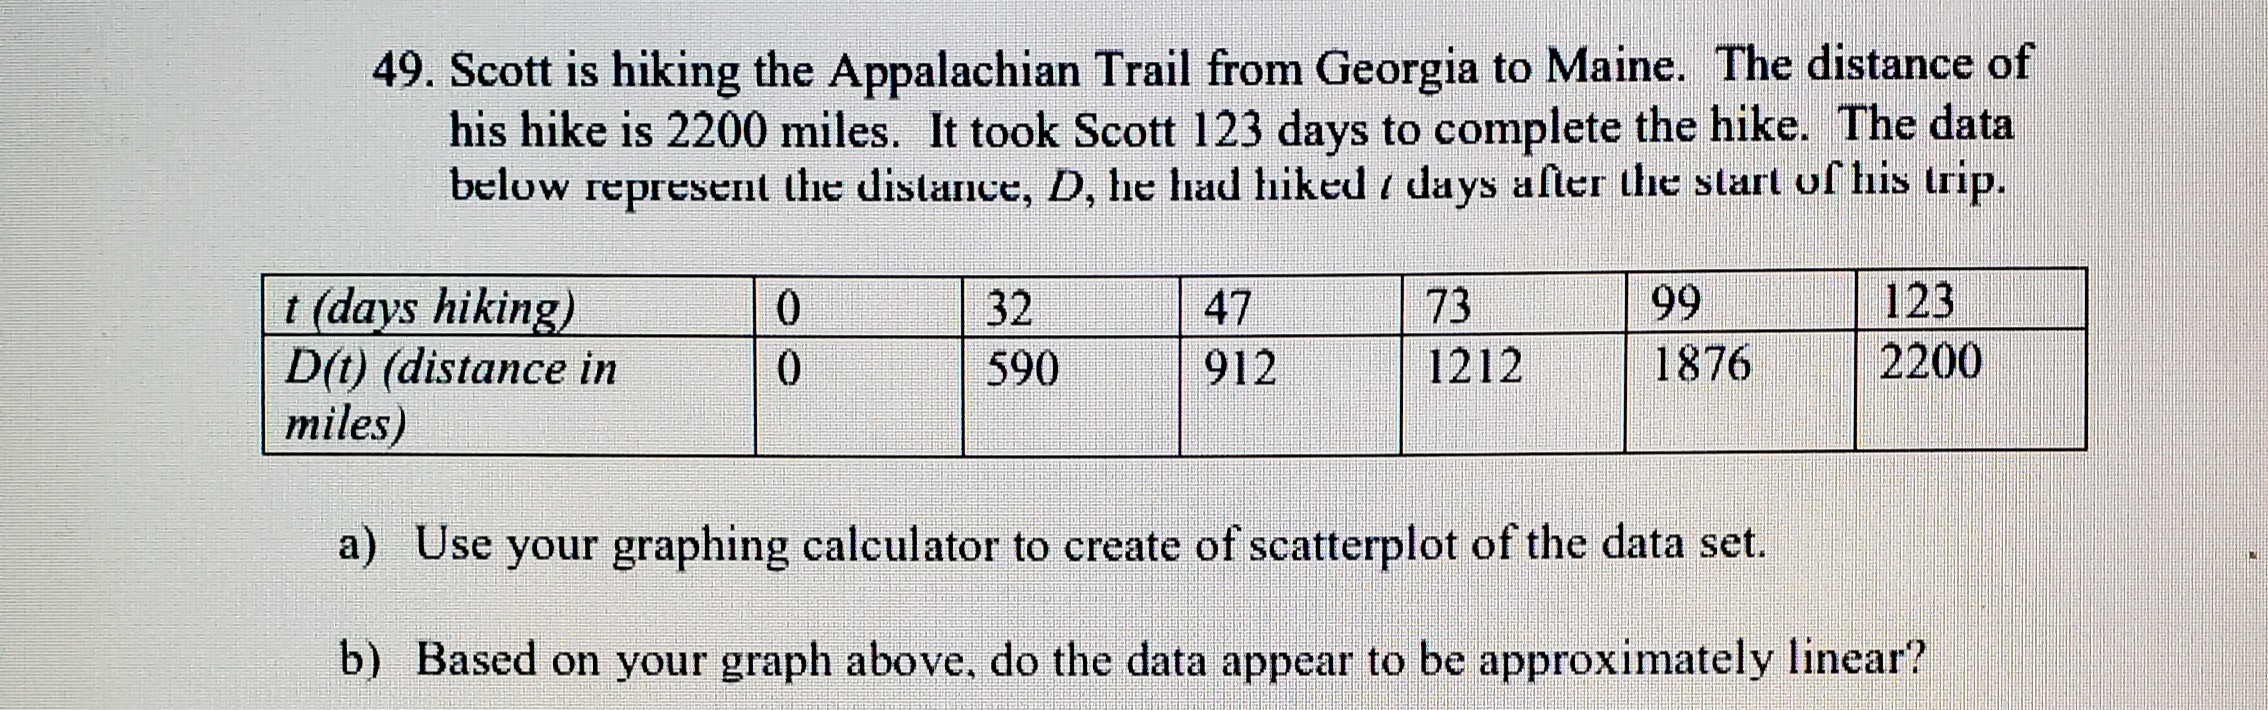
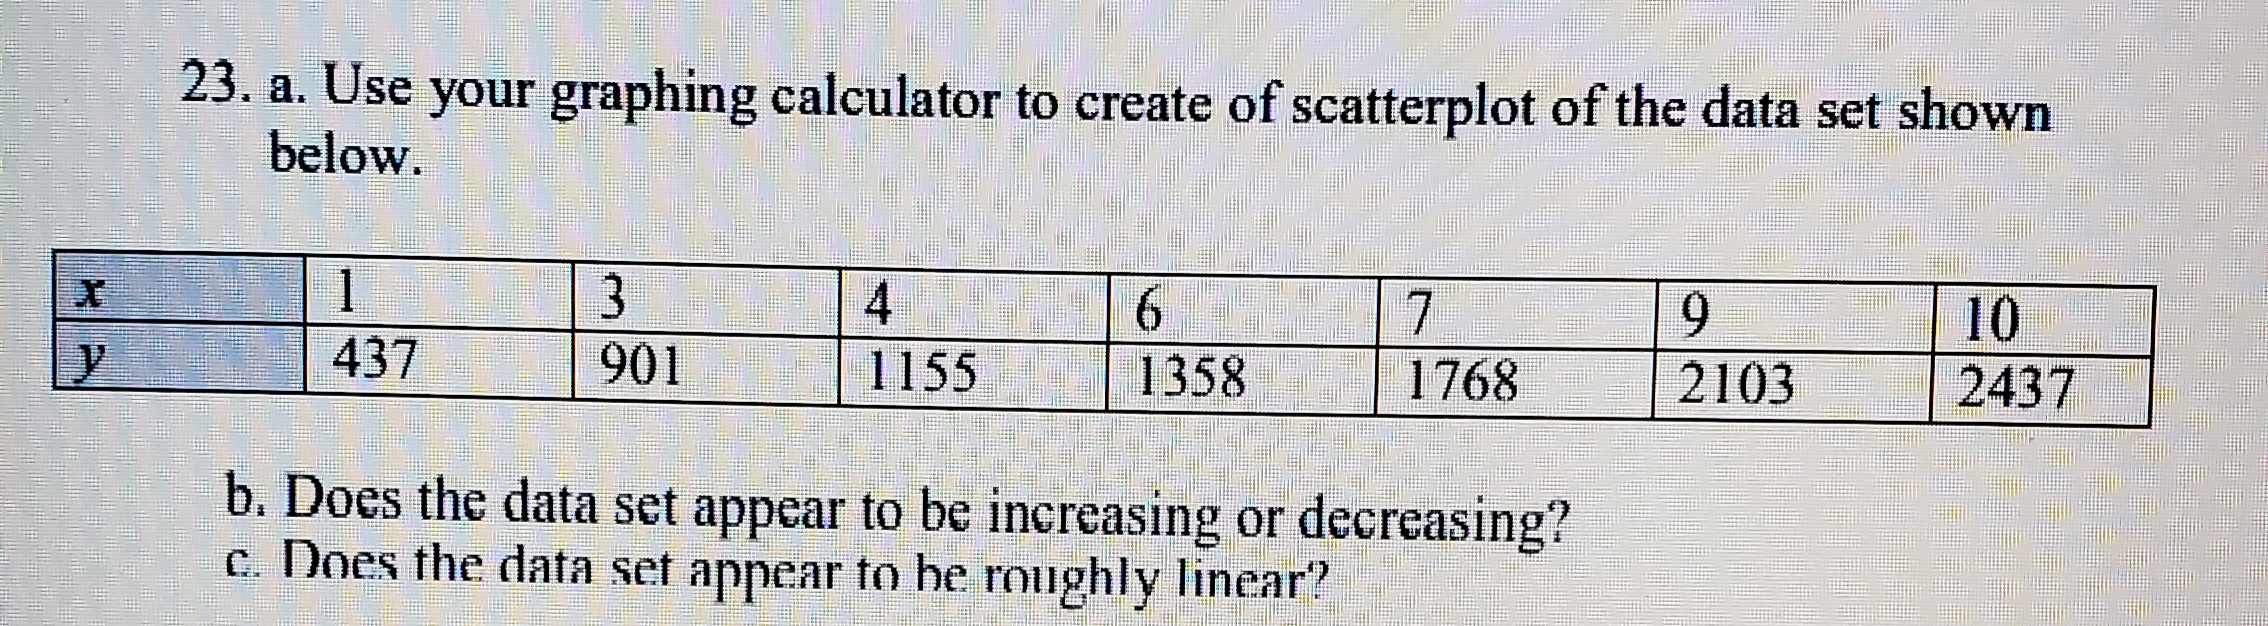
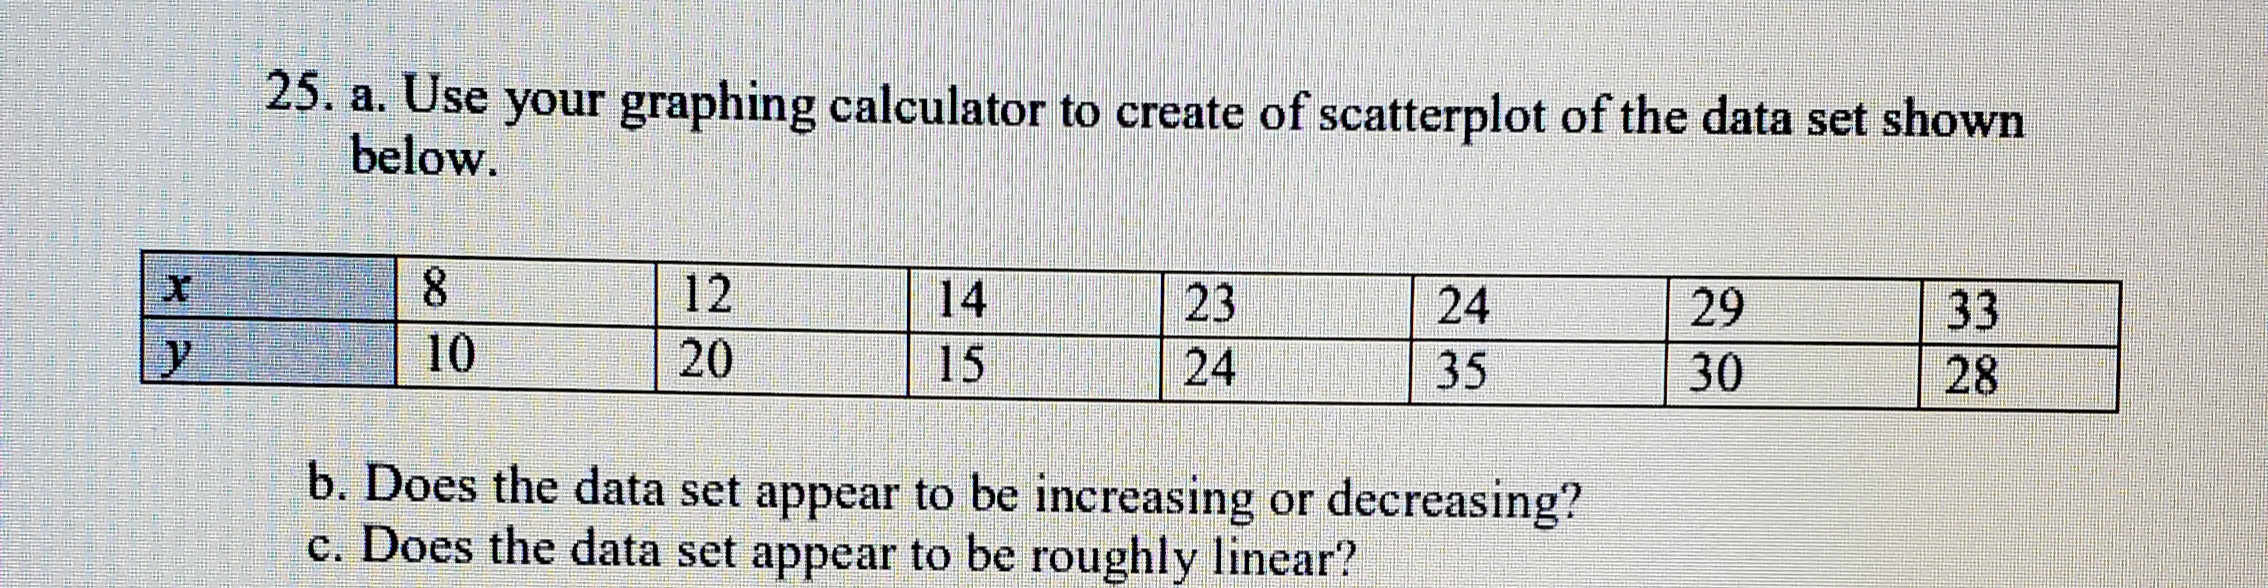
\f\f31. Find and interpret the linear correlation for the data from problem 23: X A 6 7 D 10 437 901 1155 1358 1768 2103 243733. Find and interpret the linear correlation for the data from problem 25: X 8 12 14 23 24 29 10 33 20 15 24 35 30 2835. The following table shows the number of newspaper subscriptions in Middletown, USA where t represents the number of years since 2002 (t = 0) in 2002) and S(t) represents the total subscriptions each year measured in thousands. 1 (year) 0 2 4 6 8 S(t) (total subscriptions in 448 372 198 145 45 1000's) Find and interpret the linear correlation coefficient.39. When a new charter school opened in 1996. there were 440 students enrolled. Write a formula for the function N(t), representing the number of students attending this charter school / years after 1996, assuming that the student population: a. Increased by 44 students per year b. Decreased by 32 students per year c. Remained constant (did not change)49. Scott is hiking the Appalachian Trail from Georgia to Maine. The distance of his hike is 2200 miles. It took Scott 123 days to complete the hike. The data below represent the distance, D, he had hiked / days after the start of his trip. t (days hiking) O 32 47 73 99 123 D(t) (distance in 590 912 1212 1876 2200 miles) a) Use your graphing calculator to create of scatterplot of the data set. b) Based on your graph above, do the data appear to be approximately linear?23. a. Use your graphing calculator to create of scatterplot of the data set shown below. X 3 7 9 10 437 901 1155 1358 1768 2103 2437 b. Does the data set appear to be increasing or decreasing? c. Does the data set appear to be roughly linear?25. a. Use your graphing calculator to create of scatterplot of the data set shown below. 8 12 14 10 23 24 20 29 33 15 24 35 30 28 b. Does the data set appear to be increasing or decreasing? c. Does the data set appear to be roughly linear
Step by Step Solution
There are 3 Steps involved in it

Get step-by-step solutions from verified subject matter experts