

Question: Matlab Instructions: First, enter the data and relevant equations into Matlab. *Tip: it might be easier to put the respective data set into just one
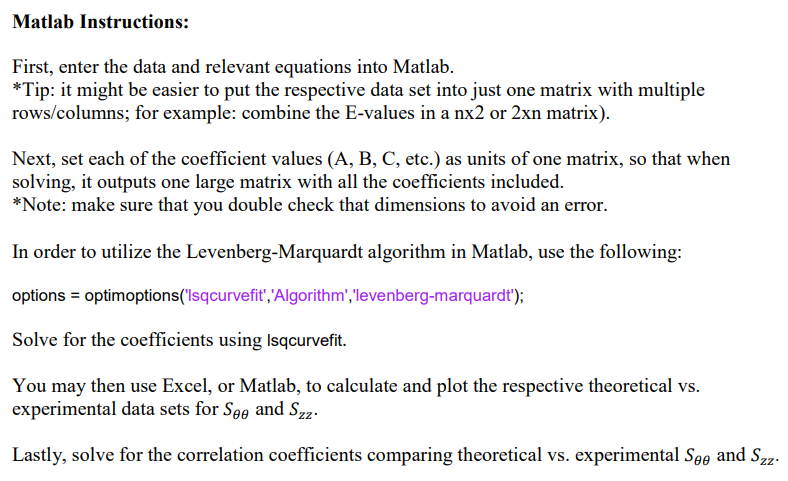
Matlab Instructions: First, enter the data and relevant equations into Matlab. *Tip: it might be easier to put the respective data set into just one matrix with multiple rows/columns; for example: combine the E-values in a nx2 or 2xn matrix). Next, set each of the coefficient values (A, B, C, etc.) as units of one matrix, so that when solving, it outputs one large matrix with all the coefficients included. *Note: make sure that you double check that dimensions to avoid an error. In order to utilize the Levenberg-Marquardt algorithm in Matlab, use the following: options = optimoptions('Isqcurvefit','Algorithm','levenberg-marquardt"); Solve for the coefficients using Isqcurvefit. You may then use Excel, or Matlab, to calculate and plot the respective theoretical vs. experimental data sets for See and Szz. Lastly, solve for the correlation coefficients comparing theoretical vs. experimental See and Szz
Step by Step Solution
There are 3 Steps involved in it

Get step-by-step solutions from verified subject matter experts