

Question: Figure 1 - Closed Loop System Using the diagram in Figure 1 , aG _ ( 1 ) ( s ) = ( K )
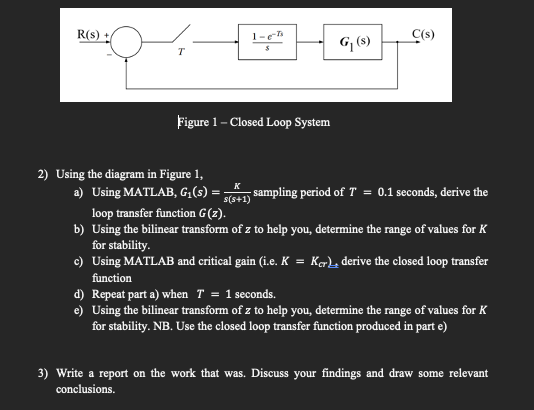
Figure Closed Loop System
Using the diagram in Figure
aGsKss sampling period of T seconds, derive the
loop transfer function Gz
bz to help you, determine the range of values for K
for stability.
cKKcr derive the closed loop transfer
function
dT seconds.
ez to help you, determine the range of values for K
for stability. NB Use the closed loop transfer function produced in part e
Step by Step Solution
There are 3 Steps involved in it
1 Expert Approved Answer
Step: 1 Unlock

Question Has Been Solved by an Expert!
Get step-by-step solutions from verified subject matter experts
Step: 2 Unlock
Step: 3 Unlock