

Question: Figure 1 . On the left - hand graph, MS represents the supply of money and MD represents the demand for money; on the right
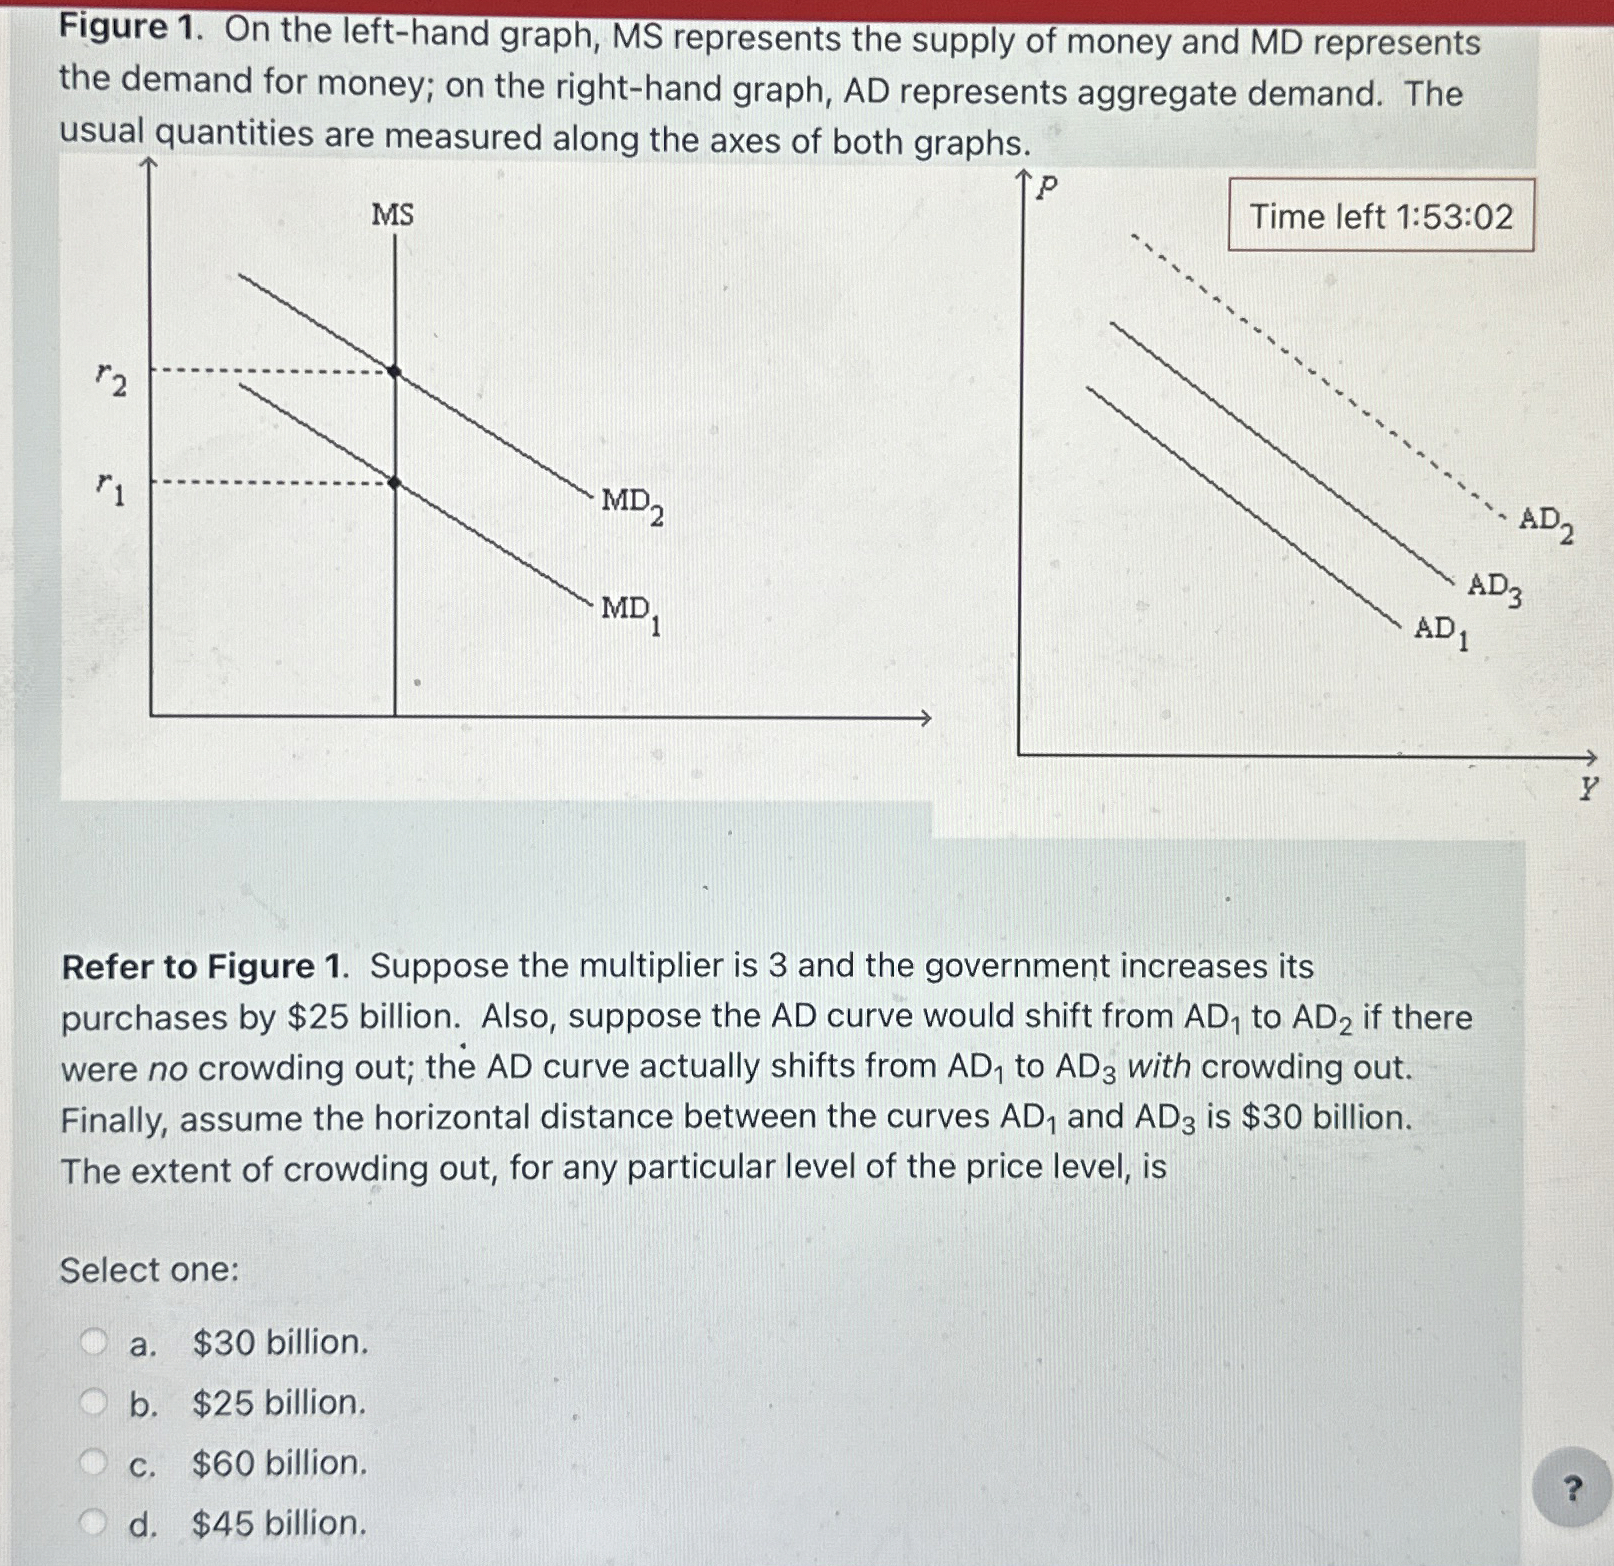
Figure On the lefthand graph, MS represents the supply of money and MD represents the demand for money; on the righthand graph, AD represents aggregate demand. The usual quantities are measured along the axes of both graphe
Refer to Figure Suppose the multiplier is and the government increases its purchases by $ billion. Also, suppose the curve would shift from to if there were no crowding out; the curve actually shifts from to with crowding out. Finally, assume the horizontal distance between the curves and is $ billion. The extent of crowding out, for any particular level of the price level, is
Select one:
a $ billion.
b $ billion.
c $ billion.
d $ billion.
Step by Step Solution
There are 3 Steps involved in it
1 Expert Approved Answer
Step: 1 Unlock

Question Has Been Solved by an Expert!
Get step-by-step solutions from verified subject matter experts
Step: 2 Unlock
Step: 3 Unlock