

Question: Figure 1 Process Flow Diagram for Production Process ................................................................ a. What are the bottleneck times for each of the three operations (lathe, mill, and grinder)?
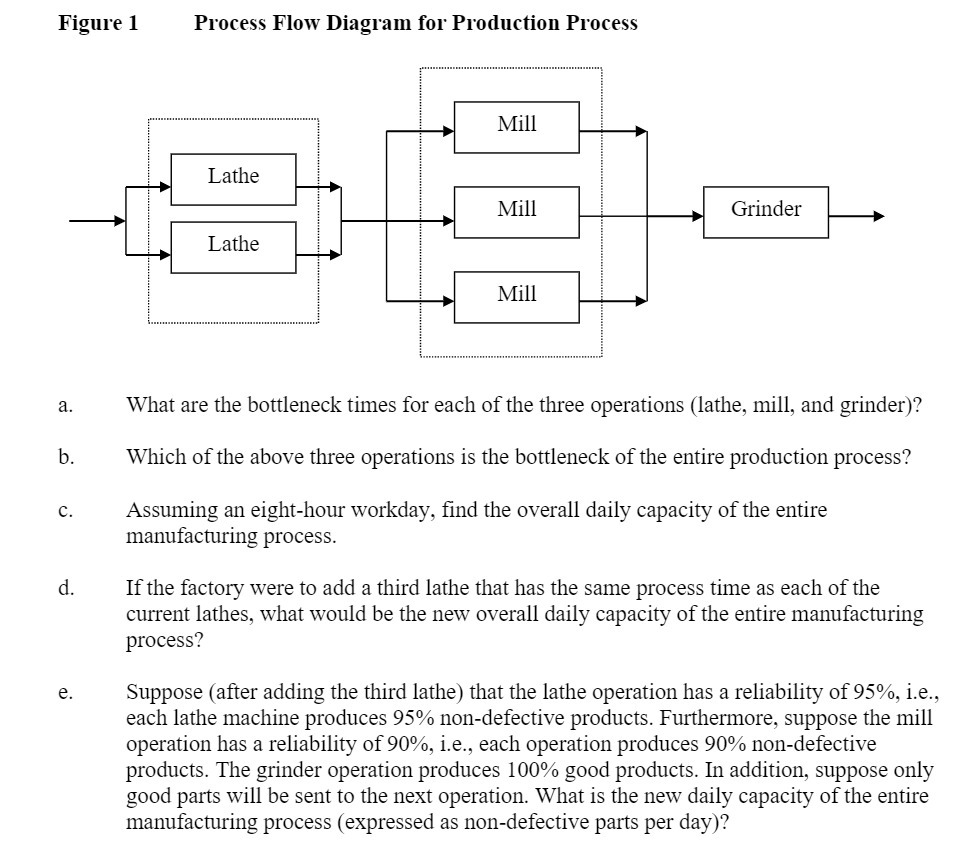
Figure 1 Process Flow Diagram for Production Process ................................................................ a. What are the bottleneck times for each of the three operations (lathe, mill, and grinder)? b- Which of the above three operations is the bottleneck of the entire production process? c. Assuming an eight-hour workday, nd the overall daily capacity of the entire manufacturing process. d. If the factory were to add a third lathe that has the same process time as each of the current lathes, what would be the new overall daily capacity of the entire manufacturing process? e. Suppose (after adding the third lathe) that the lathe operation has a reliability of 95%, Le, each lathe machine produces 95% non-defective products. Furthermore, suppose the mill operation has a reliability of 90%, i.e., each operation produces 90% non-defective products. The grinder operation produces 100% good products. In addition, suppose only good parts will be sent to the next operation. What is the new daily capacity of the entire manufacturing process (expressed as non-defective parts per day)
Step by Step Solution
There are 3 Steps involved in it

Get step-by-step solutions from verified subject matter experts