

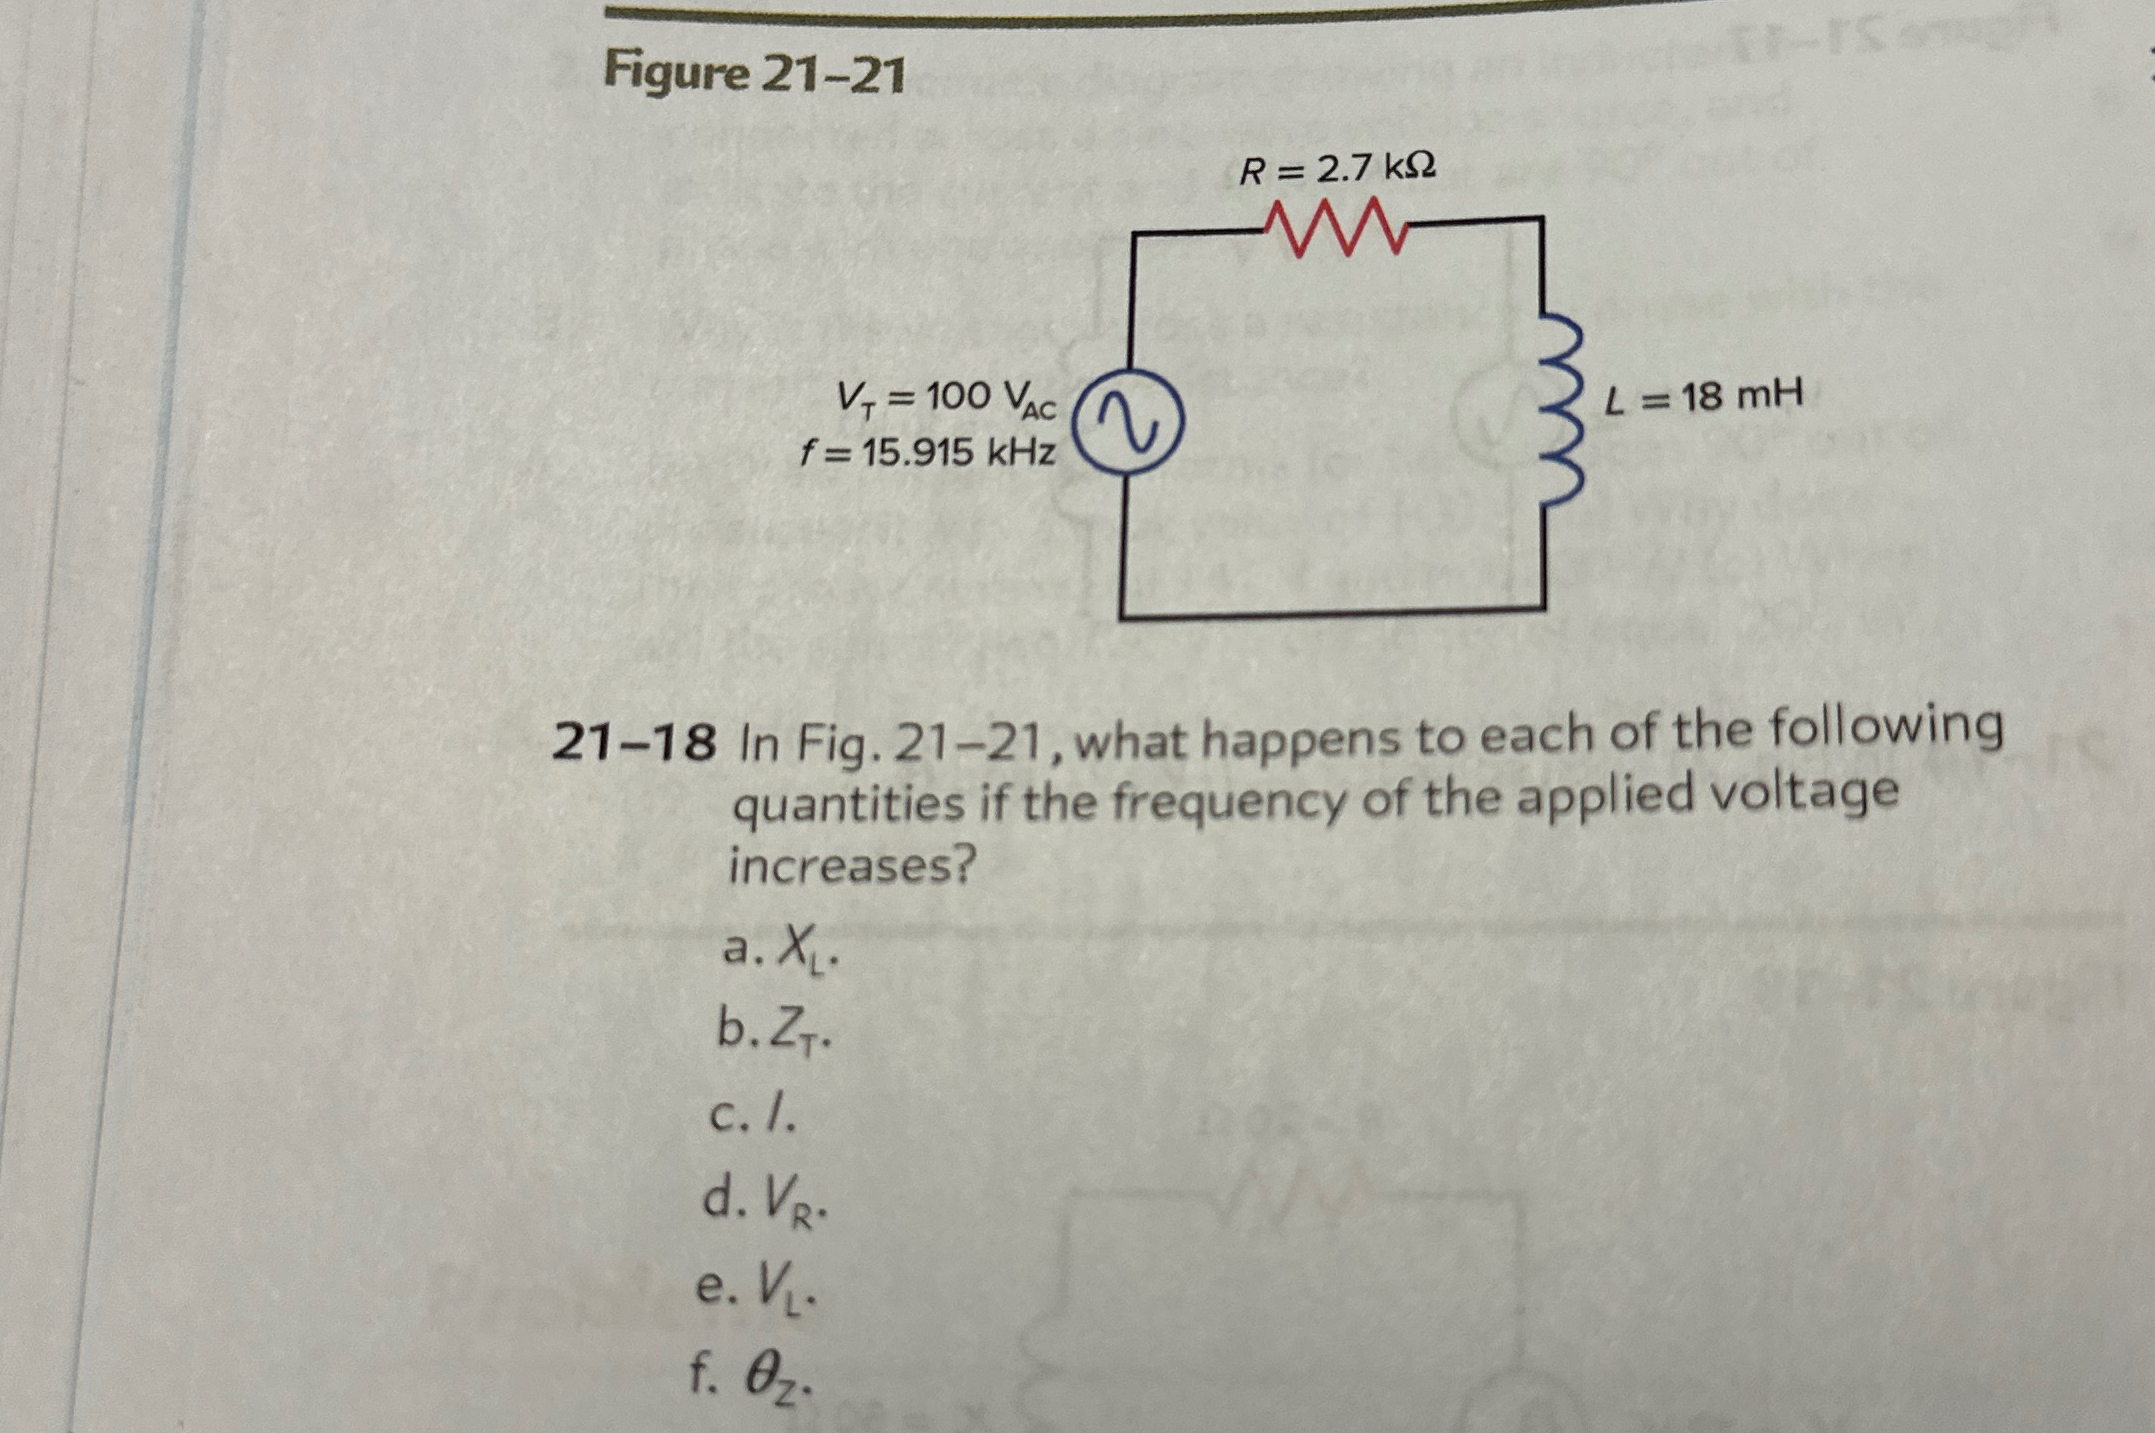
Question: Figure 2 1 - 1 3 Figure 2 1 - 2 1 2 1 - 1 8 In Fig. 2 1 - 2 1 ,
Figure
Figure
In Fig. what happens to each of the following quantities if the frequency of the applied voltage increases?
a
b
c I.
d
e
f
Step by Step Solution
There are 3 Steps involved in it
1 Expert Approved Answer
Step: 1 Unlock

Question Has Been Solved by an Expert!
Get step-by-step solutions from verified subject matter experts
Step: 2 Unlock
Step: 3 Unlock