

Question: Figure 2 - 7 Quadrant A in Figure 2 - 7 represents a ( n ) in a SWOT analysis. market segment strength opportunity threat
Figure
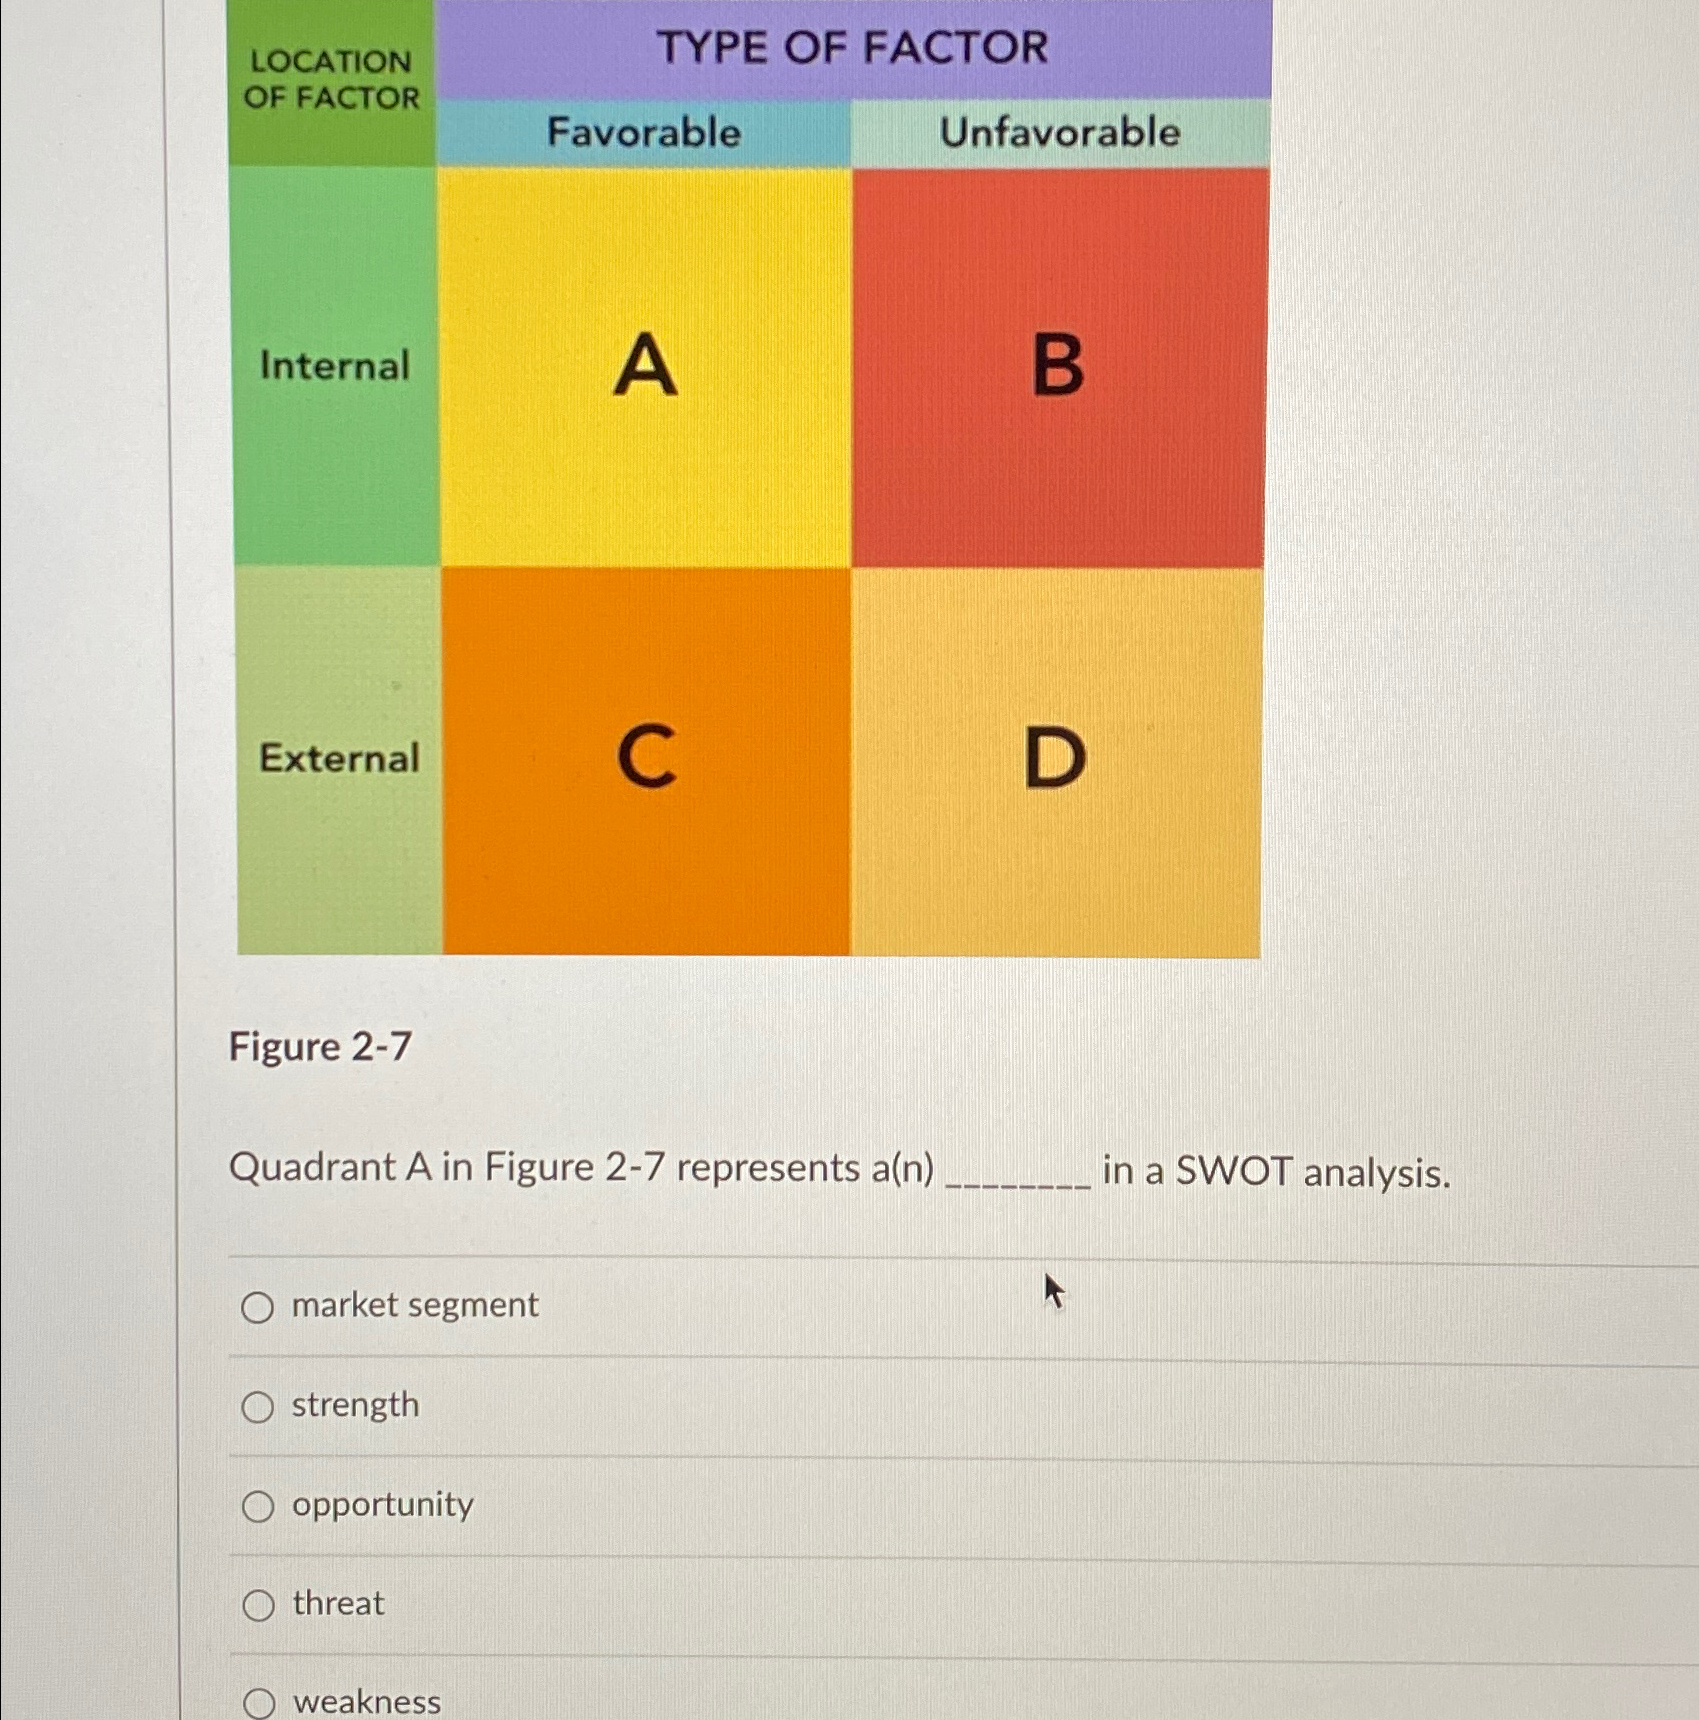
Quadrant A in Figure represents an in a SWOT analysis.
market segment
strength
opportunity
threat
weakness
Step by Step Solution
There are 3 Steps involved in it
1 Expert Approved Answer
Step: 1 Unlock

Question Has Been Solved by an Expert!
Get step-by-step solutions from verified subject matter experts
Step: 2 Unlock
Step: 3 Unlock