

Question: () Figure 29b shows a figure with two subplots, each showing the velocity vs time and the interpolation (spline, pchip). Write the MATLAB code to
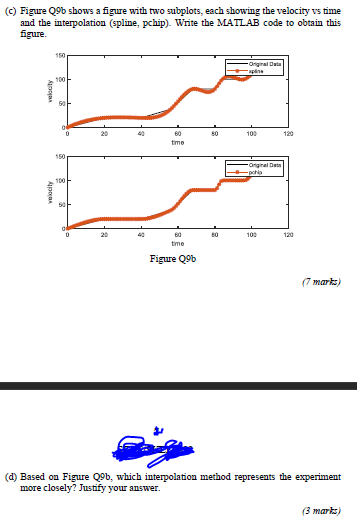
() Figure 29b shows a figure with two subplots, each showing the velocity vs time and the interpolation (spline, pchip). Write the MATLAB code to obtain this figure -Original Data upis 100 velocity 0 20 50 100 120 60 time 150 Osgral Det poh 100 velocity B0 100 120 time Figure Q9b (7 marks) (2) Based on Figure Q9b, which interpolation method represents the experiment more closely? Justify your answer. (3 marks) () Figure 29b shows a figure with two subplots, each showing the velocity vs time and the interpolation (spline, pchip). Write the MATLAB code to obtain this figure -Original Data upis 100 velocity 0 20 50 100 120 60 time 150 Osgral Det poh 100 velocity B0 100 120 time Figure Q9b (7 marks) (2) Based on Figure Q9b, which interpolation method represents the experiment more closely? Justify your
Step by Step Solution
There are 3 Steps involved in it

Get step-by-step solutions from verified subject matter experts