

Question: FIGURE 5.11 Completed two-way sensitivity graph for the stock market H v 10 problem. 0.8 Line ID has split region CDA. 0.6 Savings Account
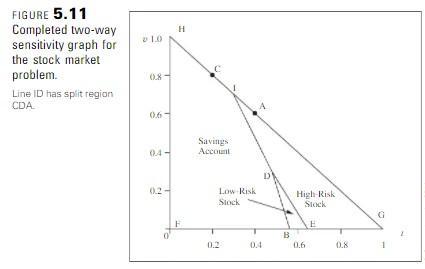
FIGURE 5.11 Completed two-way sensitivity graph for the stock market H v 10 problem. 0.8 Line ID has split region CDA. 0.6 Savings Account 0.4 0.2- Low Risk High Risk Stock Stock E B 0.2 0.4 0.6 0.8
Step by Step Solution
★★★★★
3.45 Rating (158 Votes )
There are 3 Steps involved in it
1 Expert Approved Answer
Step: 1 Unlock

Stuion 08 Sawings Accourts 06 O4 02 Low Risk STOBK Highvit tock t 02 04 O ... View full answer
Question Has Been Solved by an Expert!
Get step-by-step solutions from verified subject matter experts
Step: 2 Unlock
Step: 3 Unlock