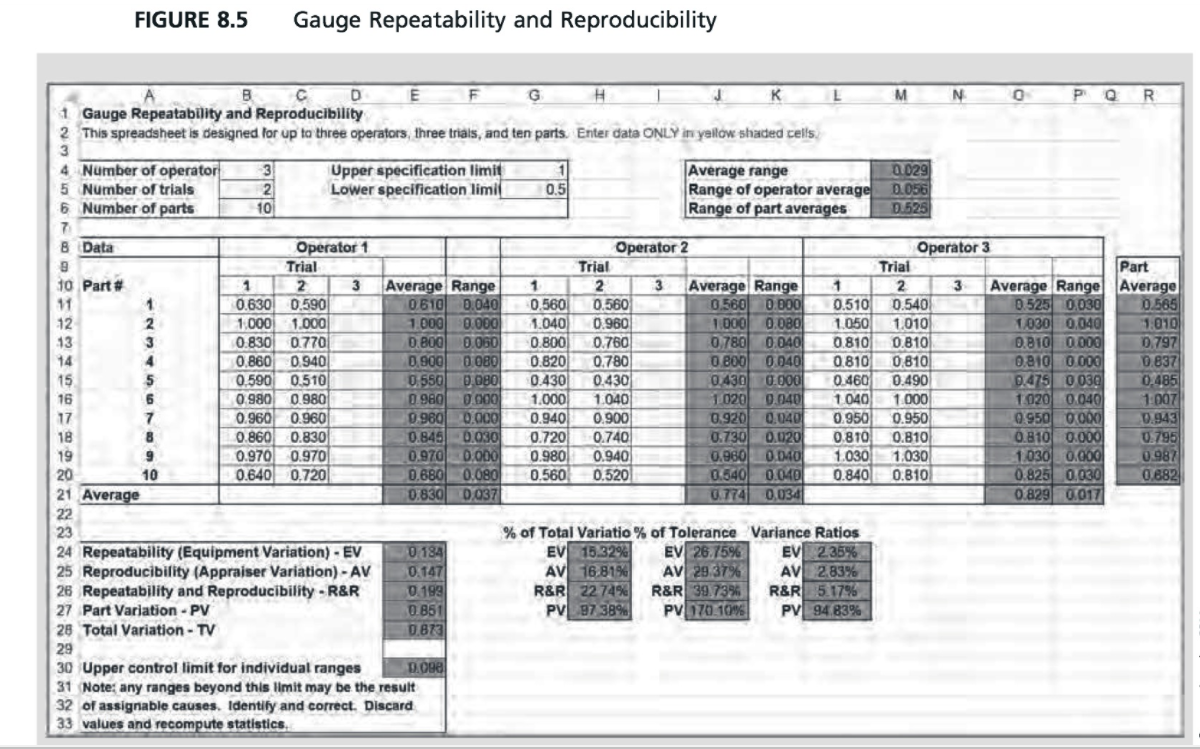
Question: FIGURE 8.5 Gauge Repeatability and Reproduciblety A B C D E F G H K M N O POR Gauge Repeatability and Reproduciblety This spreadsheet

FIGURE 8.5 Gauge Repeatability and ReproducibletyFIGURE 8.5 Gauge Repeatability and ReproducibletyFIGURE 8.5 Gauge Repeatability and ReproducibletyFIGURE 8.5 Gauge Repeatability and ReproducibletyFIGURE 8.5 Gauge Repeatability and ReproducibletyFIGURE 8.5 Gauge Repeatability and ReproducibletyFIGURE 8.5 Gauge Repeatability and Reproduciblety
FIGURE 8.5 Gauge Repeatability and Reproduciblety A B C D E F G H K M N O POR Gauge Repeatability and Reproduciblety This spreadsheet is designed for up to three operators, three trials, and ten parts. Enter data ONLY in yellow shaded cells. WN 4 Number of operator Upper specification limit Average range 0.029 5 Number of trials Lower specification limit 0.5 Range of operator average 0.056 6 Number of parts 10 Range of part averages D.525 IN Data Operator 1 Operator 2 Operator 3 Trial Trial Trial Part 10 Part # 1 2 3 Average Range 2 3 Average Range 2 3 Average Range Average 0.630 0.590 0.610 0.040 0.560 0.560 0.560 0.000 0.510 0.540 D.525 0.030 10.565 1:000 1.000 1.000 9:000 1.040 0.960 1:DO0 0.080 1.050 1.010 1/030 0.040 1:010 0.830 0.770 0.800 0.060 0:800 0.760 0 780 0:040 0.810 0.810 0.810 0.000 0.797 0.860 0.940 D.900 0:080 0.820 0.780 0.BOD 0.040 0.810 0.810 0.810 0.000 0.837 0.590 0.510 0:550 D.D80 0.430 0.430 0.430 0.000 0.460 0:490 D.475 0 030 0.485 0 980 0.980 0.980 0.900 1.000 1.040 1 020 9.040 1 040 1:000 1 020 0.040 1:007 0.960 0.960 0.960 0.000 0.940 0.900 0.920 0.040 0.950 0.950 0.950 0:000 0.943 0.860 0.830 0.845 0.030 0.720 0.740 0.730 0.020 0.810 0.810 0.810 0.000 0:795 0.970 0.970 0.970 0.000 0.980 0.940 0.960 0.040 1.030 1,030 1030 0.000 0.987 10 0.640 0,720 D.680 0.080 0.560 0.520 0.540 0.040 0.840 0:810 0.825 0,030 0.682 21 Average 0.830 D.037 0.774 0,034 0.829 0.017 22 23 % of Total Variation Tolerance Variance Ratios 24 Repeatability (Equipment Variation) - EV 0 184 EV 15.32% EV 26.75% EV 235% 25 Reproduciblety (Appraiser Variation) - AV 0.147 AV 16 81% AV 29.37% AV 2.83% 26 Repeatability and Reproduciblety - R&R 0.193 R&R 22 74% R&R 39.7354 R&R 5 17% 27 Part Variation - PV 0.851 PV 97 38% PV )70 10% PV 94.83% 28 Total Variation - TV D.873 29 30 Upper control limit for individual ranges 31 Note: any ranges beyond this limit may be the result 32 of assignable causes. Identify and correct. Discard 33 values and recompute statistics,\f\f\f1 Problem 8-47 2 PharmaSuitica Number of Defects 5 Sample per order (200 product order) 9 10 11 12 6 13 7 14 8 15 9 16 10 17 11 18 12 19 13 20 14 21 15 22 16 4 23 17 2 24 18 25 19 26 20 27 21 28 22 2 29 23 30 24 31 25 32 26 2 33 27 2 34 28 35 29 36 30 37 38 61 39 40\f\f

Step by Step Solution

There are 3 Steps involved in it

1 Expert Approved Answer
Step: 1 Unlock blur-text-image
Question Has Been Solved by an Expert!

Get step-by-step solutions from verified subject matter experts

Step: 2 Unlock
Step: 3 Unlock

Students Have Also Explored These Related Accounting Questions!