

Question: Figure A.27 is the above table Suppose an application has the average CPI for different instruction types listed in the following table. The distribution of
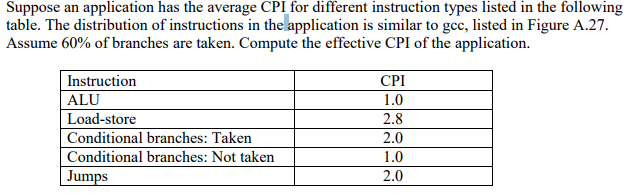
Figure A.27 is the above table
Suppose an application has the average CPI for different instruction types listed in the following table. The distribution of instructions in the application is similar to gcc, listed in Figure A.27. Assume 60% of branches are taken. Compute the effective CPI of the application. Instruction AIIJ Load-store Conditional branches: Taken CPI 1.0 2.8 2.0 1.0 2.0 Jumps
Step by Step Solution
There are 3 Steps involved in it
1 Expert Approved Answer
Step: 1 Unlock

Question Has Been Solved by an Expert!
Get step-by-step solutions from verified subject matter experts
Step: 2 Unlock
Step: 3 Unlock