

Question: Figure for Multiple Activity Chart Problem, Question No. 31. TIME (MIN) 1.5 MACHINE A ACTIVITY LOAD INSPECT TRAVEL MACHINING UNLOAD TIME (MIN) 1 0.5 0.5
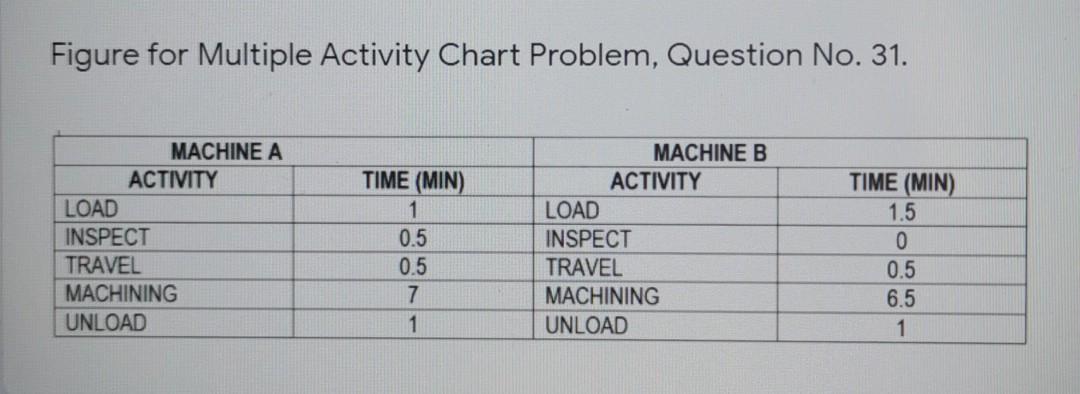
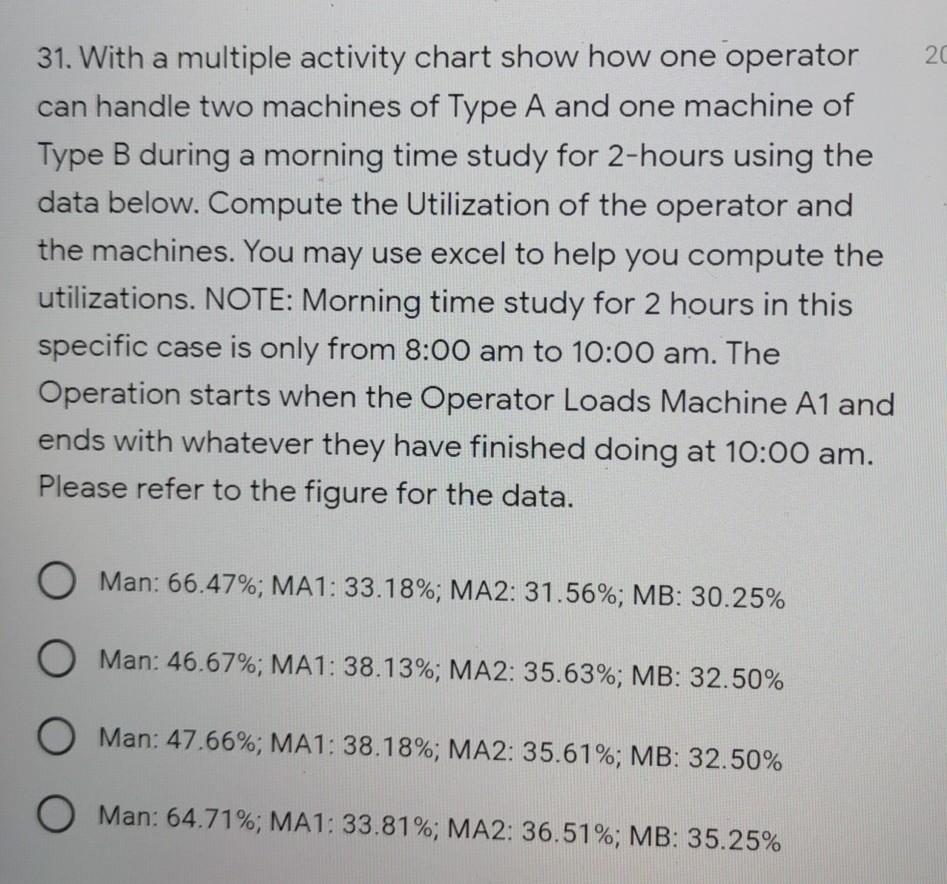
Figure for Multiple Activity Chart Problem, Question No. 31. TIME (MIN) 1.5 MACHINE A ACTIVITY LOAD INSPECT TRAVEL MACHINING UNLOAD TIME (MIN) 1 0.5 0.5 7 MACHINE B ACTIVITY LOAD INSPECT TRAVEL MACHINING UNLOAD 0.5 6.5 1 1 20 31. With a multiple activity chart show how one operator can handle two machines of Type A and one machine of Type B during a morning time study for 2-hours using the data below. Compute the Utilization of the operator and the machines. You may use excel to help you compute the utilizations. NOTE: Morning time study for 2 hours in this specific case is only from 8:00 am to 10:00 am. The Operation starts when the Operator Loads Machine A1 and ends with whatever they have finished doing at 10:00 am. Please refer to the figure for the data. Man: 66.47%; MA1: 33.18%; MA2: 31.56%; MB: 30.25% O Man: 46.67%; MA1:38.13%; MA2: 35.63%; MB: 32.50% O Man: 47.66%; MA1: 38.18%; MA2: 35.61%; MB: 32.50% O Man: 64.71%; MA1: 33.81%; MA2: 36.51%; MB: 35.25%
Step by Step Solution
There are 3 Steps involved in it
1 Expert Approved Answer
Step: 1 Unlock

Question Has Been Solved by an Expert!
Get step-by-step solutions from verified subject matter experts
Step: 2 Unlock
Step: 3 Unlock