

Question: figure legend: A box plot is utilized to conduct a Mann-Whitney test on qPCR results for each of the three MSRE amplicons. The three amplicons
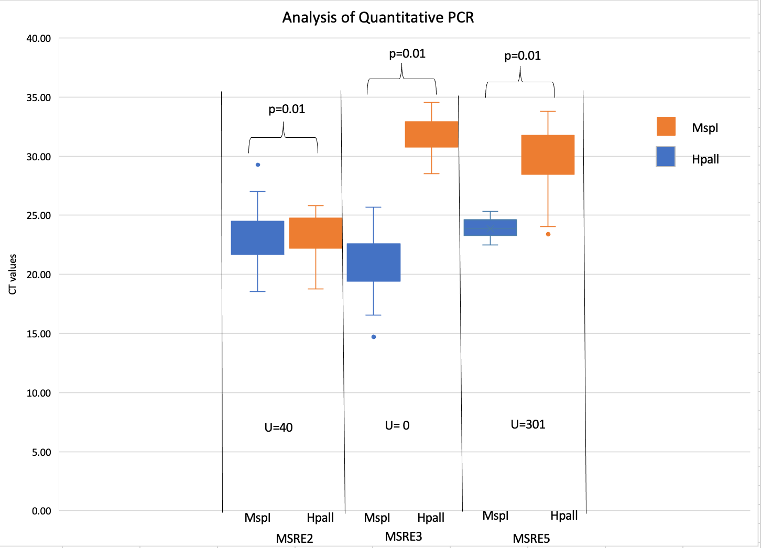
figure legend: A box plot is utilized to conduct a Mann-Whitney test on qPCR results for each of the three MSRE amplicons. The three amplicons are MSRE 2,3 and 5 that are on the x-axis and the CT values are on the y-axis. The ct-values are box plotted in two colours. The colour blue represents MspI and the colour orange represents Hpall. These are divided into three panels. The first panel starting from left has a U-value of 40, the second panel U value= 0 and the third panel U value= 301.
1. What is being analysed in the qPCR assay?
2. Is there any evidence of differences in the distribution of Ct values between the MspI and HpaII Ct values for each of the three MSRE amplicons?
3. If there IS A DIFFERENCE in the distribution of Ct values between the MspI and HpaII Ct values for an MSRE amplicon, what does this mean?
4. If there NO DIFFERENCE in the distribution of Ct values between the MspI and HpaII Ct values for an MSRE amplicon, what does this mean?
5. What is the size distribution of the fragments in the amplified DNA library? Is there an even distribution, or are the fragments concentrated within a specific region?
=1,rn
Step by Step Solution
There are 3 Steps involved in it

Get step-by-step solutions from verified subject matter experts