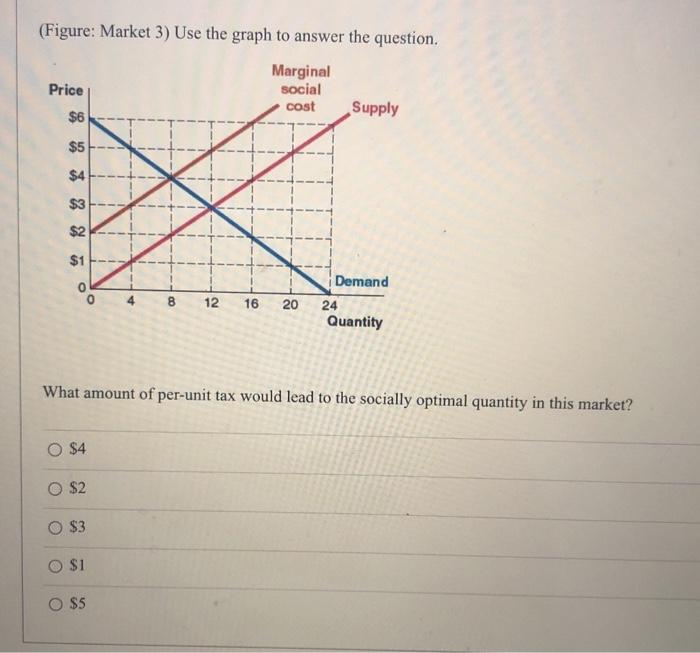
Question: (Figure: Market 3) Use the graph to answer the question. Price Marginal social cost Supply $6 $5 $4 $3 $2 $1 0 4 B 12

(Figure: Market 3) Use the graph to answer the
(Figure: Market 3) Use the graph to answer the question. Price Marginal social cost Supply $6 $5 $4 $3 $2 $1 0 4 B 12 16 20 Demand 24 Quantity What amount of per-unit tax would lead to the socially optimal quantity in this market? O $4 $2 O $3 O $1 O $5

Step by Step Solution

There are 3 Steps involved in it

1 Expert Approved Answer
Step: 1 Unlock blur-text-image
Question Has Been Solved by an Expert!

Get step-by-step solutions from verified subject matter experts

Step: 2 Unlock
Step: 3 Unlock

Students Have Also Explored These Related General Management Questions!