

Figure Q1 shows a single-line diagram of a 5-bus power system. Input data are given in Tables
Question:
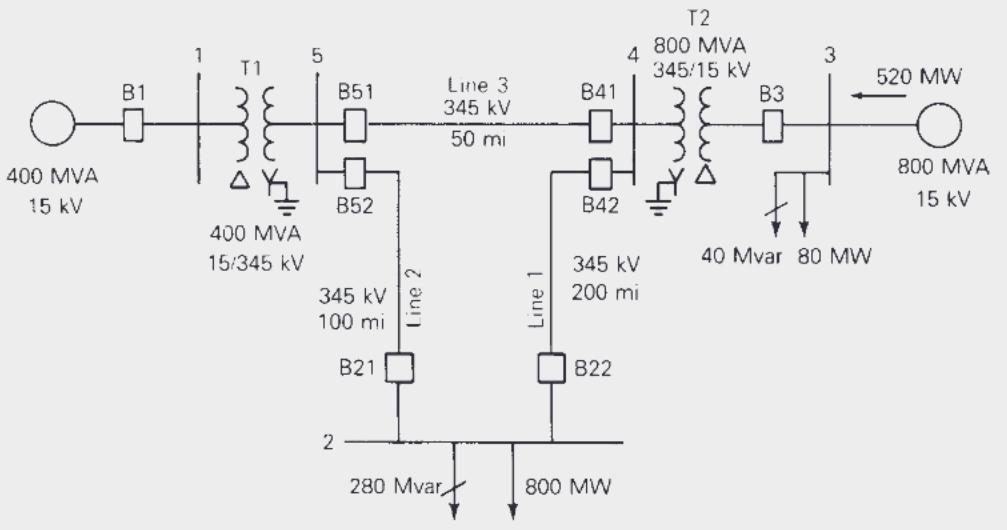
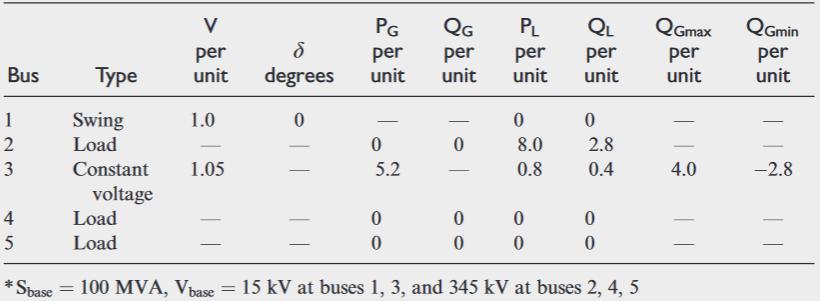
Figure Q1 shows a single-line diagram of a 5-bus power system. Input data are given in Tables 1.1, 1.2, and 1.3. As shown in Table 1.1, bus 1, to which a generator is connected, is the swing bus. Bus 3, to which a generator and a load are connected, is a voltage-controlled bus. Buses 2, 4, and 5 are load buses. Note that the loads at buses 2 and 3 are inductive since Q2=-QL2=-2.8![]() and -QL3=-0.4
and -QL3=-0.4![]() are negative.
are negative.
Using Matlab, determine Ybus![]() matrix. Assume a flat start (i.e., all the bus angles are all zero, the generator voltage magnitudes as given and all load bus voltage magnitudes as 1.0 p.u.), to calculate the bus fault current (both real and reactive power).
matrix. Assume a flat start (i.e., all the bus angles are all zero, the generator voltage magnitudes as given and all load bus voltage magnitudes as 1.0 p.u.), to calculate the bus fault current (both real and reactive power).
Figure Q1
Continue with this 5-bus system to find the load flow solution using:
(a) Fast Decoupled Newton-Raphson
(b) Full Newton-Raphson
(c) Include the line flows in your solution as well as the voltages and compare the solutions in terms of number of iterations to converge and computations (use Matlab function profile report to generate a breakdown of computation time).
Note: You need to re-number the buses so that the generators and load buses are in sequence (i.e., bus 2 and 3 are swapped).
Bus input data:
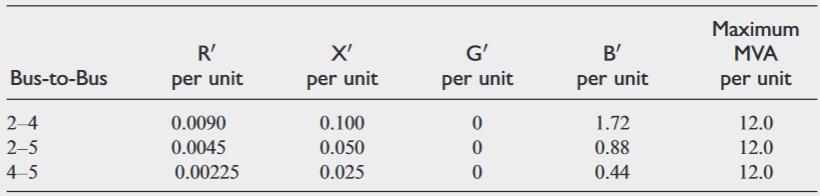
Line Input data:
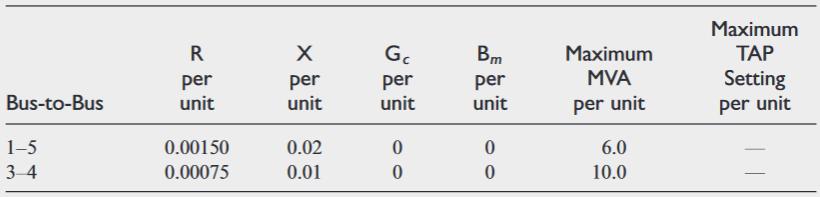
Transformer Input data:
Expert Answer:


Process Dynamics and Control
ISBN: 978-1119385561
4th edition
Authors: Dale E. Seborg, Thomas F. Edgar, Duncan A. Mellichamp, Francis J. Doyle
