

Question: Figure Q3(b) shows a typical duct network for an air conditioning system. Sketch the likely total pressure (total head) distribution along the ductwork at
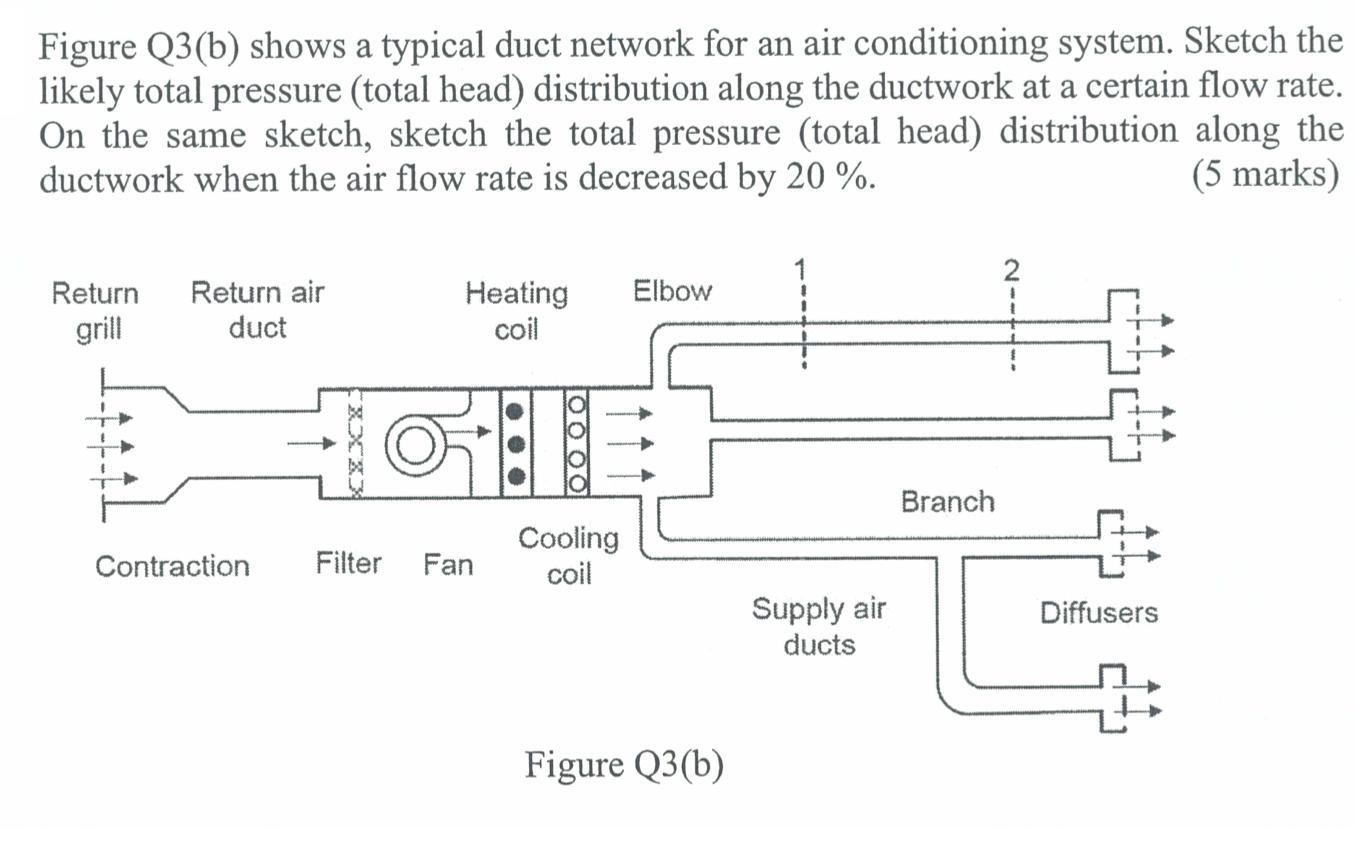
Figure Q3(b) shows a typical duct network for an air conditioning system. Sketch the likely total pressure (total head) distribution along the ductwork at a certain flow rate. On the same sketch, sketch the total pressure (total head) distribution along the ductwork when the air flow rate is decreased by 20 %. (5 marks) Return Return air grill duct Heating coil Contraction Filter Fan Cooling coil Elbow Figure Q3(b) Supply air ducts Branch Diffusers
Step by Step Solution
★★★★★
3.43 Rating (159 Votes )
There are 3 Steps involved in it
1 Expert Approved Answer
Step: 1 Unlock

Question Has Been Solved by an Expert!
Get step-by-step solutions from verified subject matter experts
Step: 2 Unlock
Step: 3 Unlock