

Question: File Home Developer Insert Page Layout Formulas Data Review View Automate (i) PROTECTED VIEW Be careful-files from the Internet can contain viruses. Unless you need
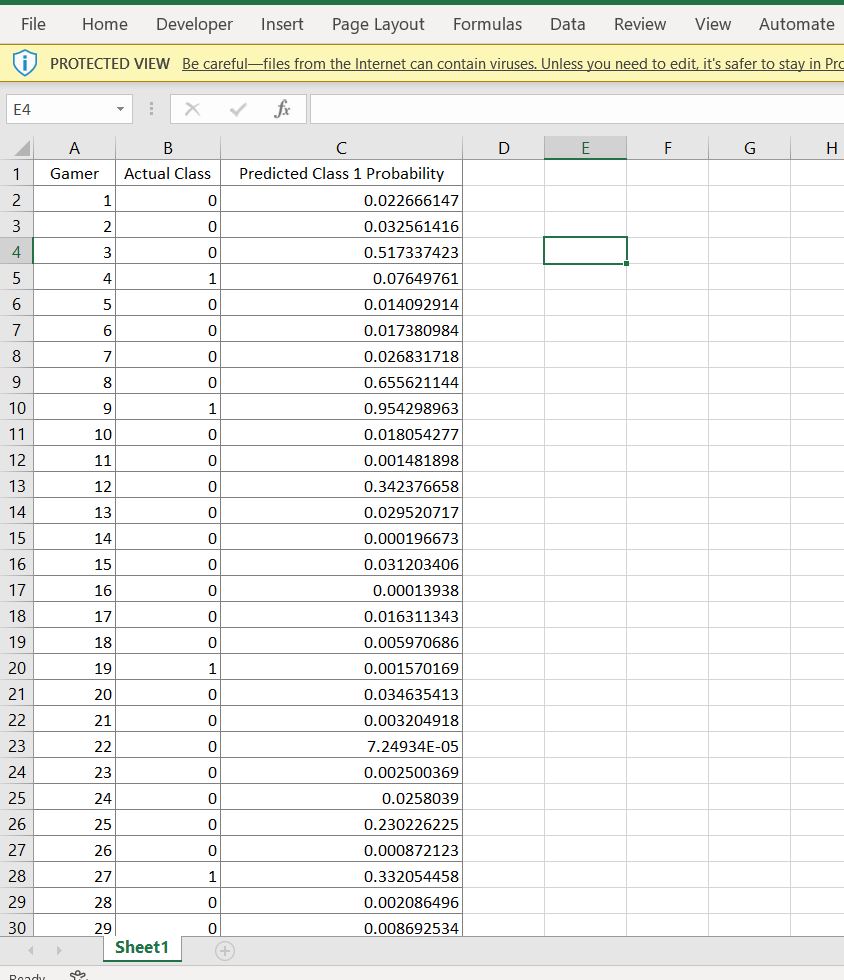
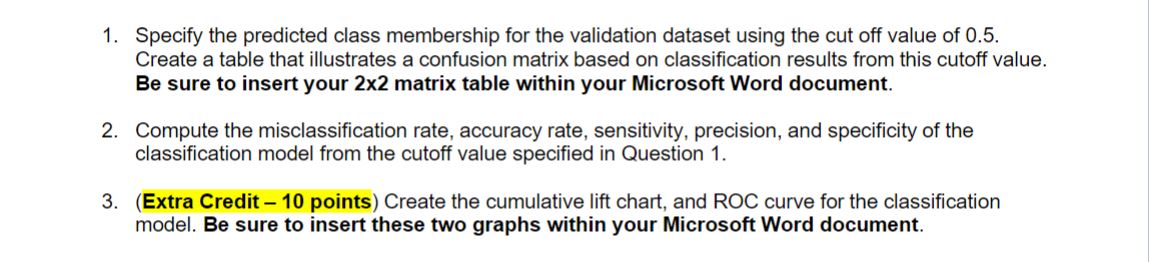
File Home Developer Insert Page Layout Formulas Data Review View Automate (i) PROTECTED VIEW Be careful-files from the Internet can contain viruses. Unless you need to edit, it's safer to stay in Pro 1. Specify the predicted class membership for the validation dataset using the cut off value of 0.5 . Create a table that illustrates a confusion matrix based on classification results from this cutoff value Be sure to insert your 22 matrix table within your Microsoft Word document. 2. Compute the misclassification rate, accuracy rate, sensitivity, precision, and specificity of the classification model from the cutoff value specified in Question 1. 3. (Extra Credit - 10 points) Create the cumulative lift chart, and ROC curve for the classification model. Be sure to insert these two graphs within your Microsoft Word document
Step by Step Solution
There are 3 Steps involved in it

Get step-by-step solutions from verified subject matter experts