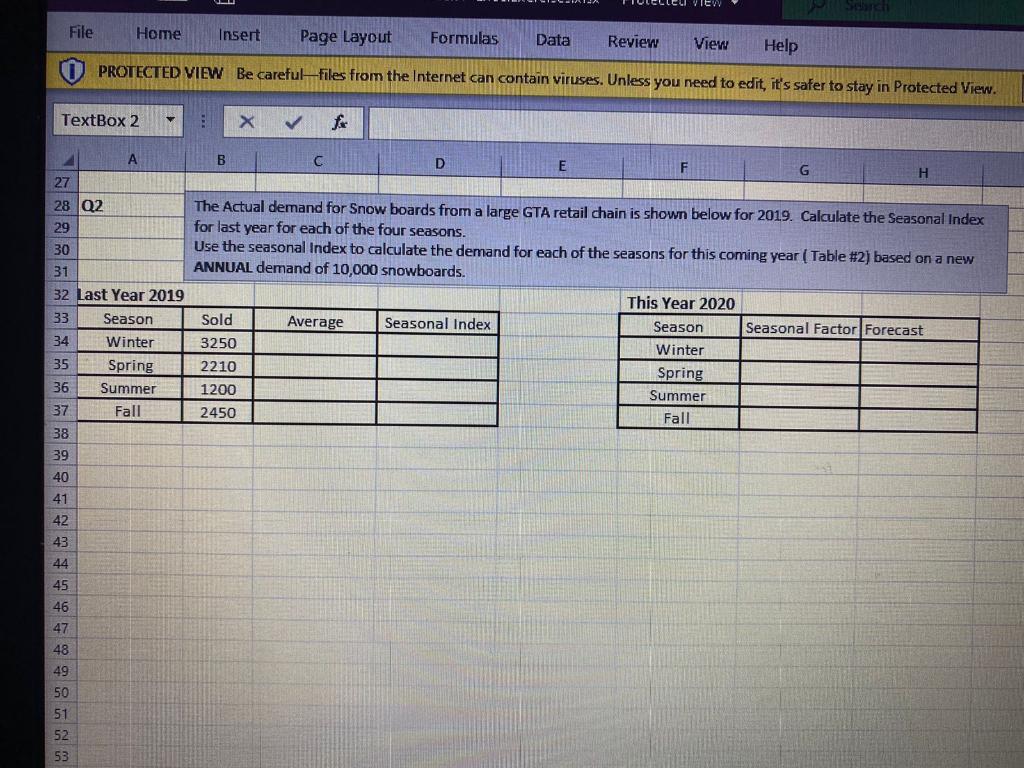
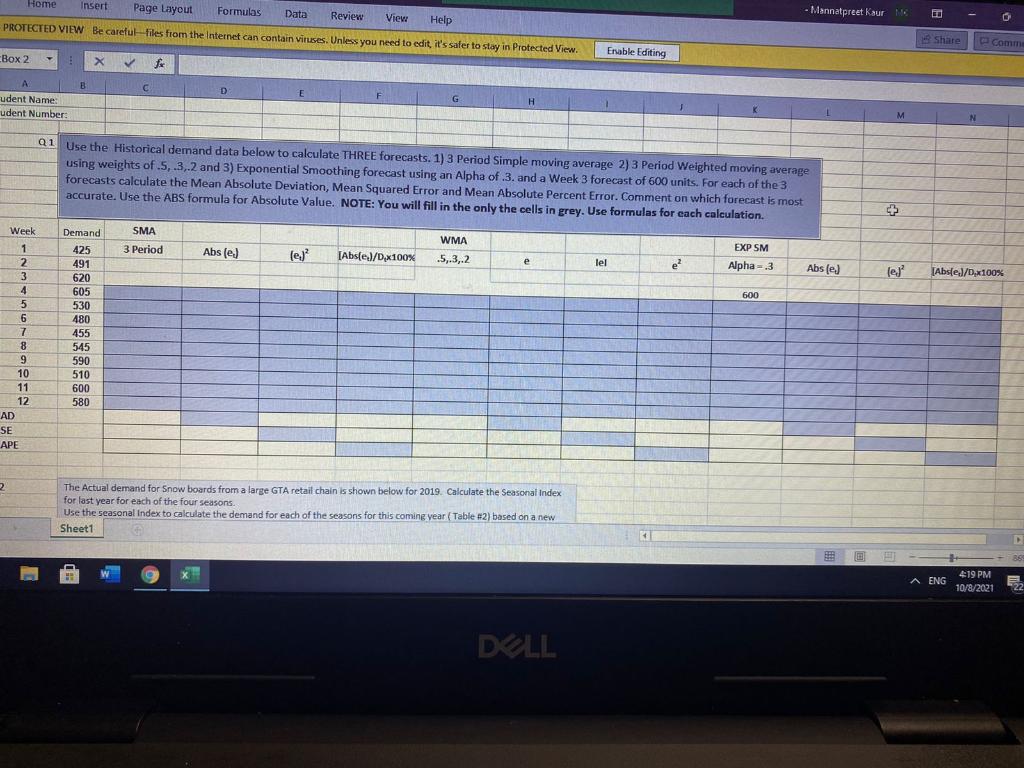
Question: File Home Insert Page Layout Formulas Data Review View Help PROTECTED VIEW Be careful_files from the Internet can contain viruses. Unless you need to edit,

File Home Insert Page Layout Formulas Data ReviewFile Home Insert Page Layout Formulas Data Review

File Home Insert Page Layout Formulas Data Review View Help PROTECTED VIEW Be careful_files from the Internet can contain viruses. Unless you need to edit, it's safer to stay in Protected View. TextBox 2 X A B D E F H 27 28 02 The Actual demand for Snow boards from a large GTA retail chain is shown below for 2019. Calculate the Seasonal Index 29 for last year for each of the four seasons. 30 Use the seasonal Index to calculate the demand for each of the seasons for this coming year ( Table #2) based on a new ANNUAL demand of 10,000 snowboards. 31 32 Last Year 2019 This Year 2020 33 Season Sold Average Seasonal Index Season Seasonal Factor Forecast 34 Winter 3250 Winter 35 Spring 2210 Spring 36 Summer 1200 Summer 37 Fall 2450 Fall 38 39 40 41 42 43 44 45 46 47 48 49 50 51 52 53 Home Insert Page Layout Formulas Data Review - Mannatpreet Kaur Me 50 View Help o PROTECTED VIEW Be careful files from the Internet can contain viruses. Unless you need to edit, it's safer to stay in Protected View. 3 Share Comm Enable Editing Box 2 X fo B D E udent Name: udent Number: G H M N 21 Use the Historical demand data below to calculate THREE forecasts. 1) 3 Period Simple moving average 2) 3 Period Weighted moving average using weights of.5.3,-2 and 3) Exponential Smoothing forecast using an Alpha of 3. and a Week 3 forecast of 600 units. For each of the 3 forecasts calculate the Mean Absolute Deviation, Mean Squared Error and Mean Absolute Percent Error. Comment on which forecast is most accurate. Use the ABS formula for Absolute Value. NOTE: You will fill in the only the cells in grey. Use formulas for each calculation Week Demand SMA WMA 3 Period Abs (e.) [Abs(e)/D,x100% .5.3.2 EXP SM Alpha-3 e lel e? Abs (e) [Absel/Dx 100% 600 1 2 3 4 4 5 6 7 8 9 10 11 12 AD SE APE 425 491 620 605 530 480 455 545 590 510 600 580 2 The Actual demand for Snow boards from a large GTA retail chain is shown below for 2019. Calculate the Seasonal Index for last year for each of the four seasons. Use the seasonal Index to calculate the demand for each of the seasons for this coming year (Table #2) based on a new Sheet1 X A ENG 419 PM 10/8/2021 22 DOLL

Step by Step Solution

There are 3 Steps involved in it

1 Expert Approved Answer
Step: 1 Unlock blur-text-image
Question Has Been Solved by an Expert!

Get step-by-step solutions from verified subject matter experts

Step: 2 Unlock
Step: 3 Unlock

Students Have Also Explored These Related General Management Questions!