

Question: Fill in the blanks: A B 2015 2016 2015 2016 Real GDP $150 billion $165 billion $300 billion $315 billion Population 50 million 55 million


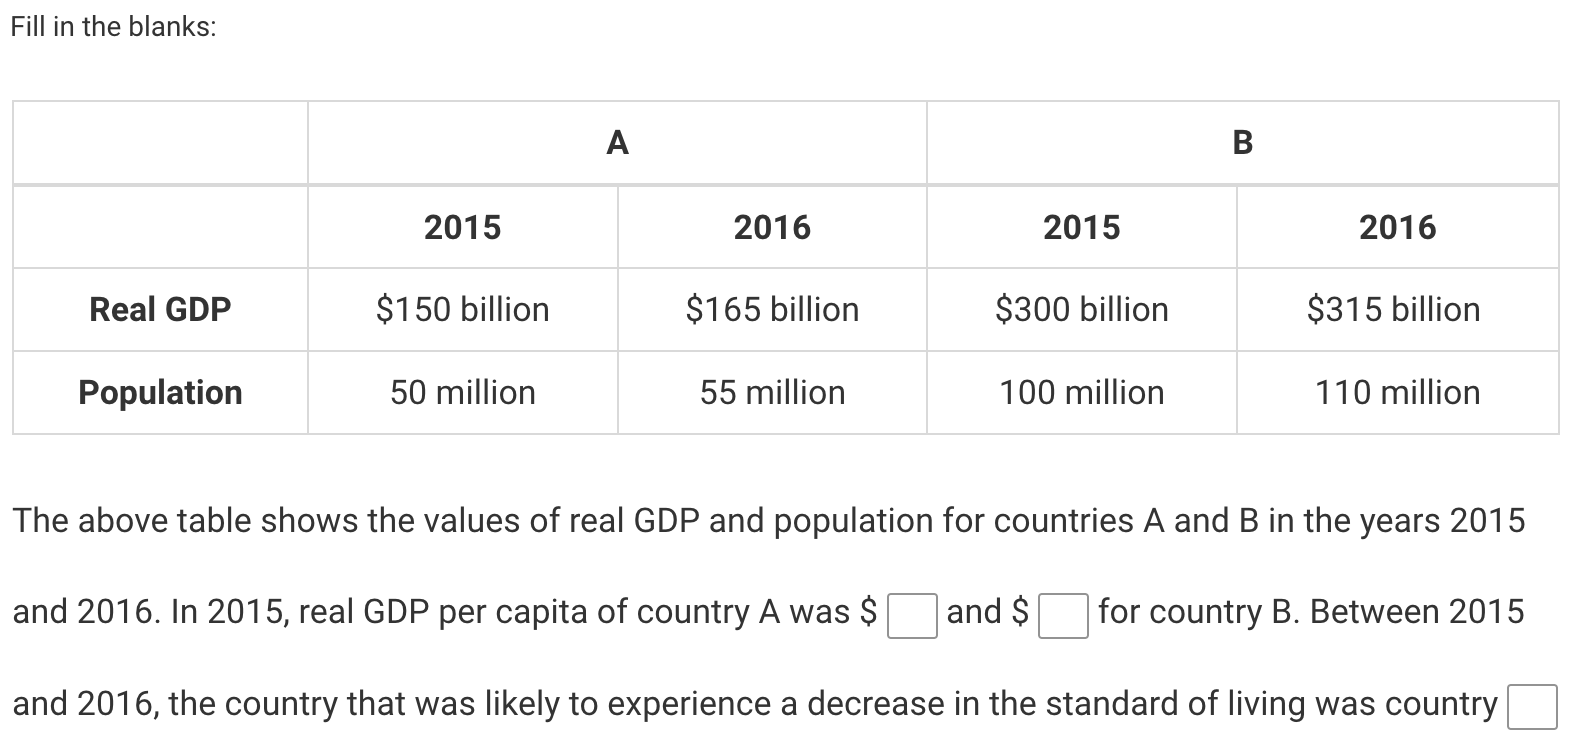

Fill in the blanks: A B 2015 2016 2015 2016 Real GDP $150 billion $165 billion $300 billion $315 billion Population 50 million 55 million 100 million 110 million The above table shows the values of real GDP and population for countries A and B in the years 2015 and 2016. In 2015, real GDP per capita of country A was 3 l: and $ '3 for country B. Between 2015 and 201 6, the country that was likely to experience a decrease in the standard of living was country a When people accumulate knowledge and skills, they are building A human capital. B physical capital. C internal capital. D learning by doing. Economic growth is represented by A the short-term fluctuations in real GDP. B the long-term trend in real GDP. C the difference between long-run growth and the growth trend. D the difference between real and nominal GDP
Step by Step Solution
There are 3 Steps involved in it

Get step-by-step solutions from verified subject matter experts