

Question: fill in the gant chart below (until time 20) for the most feasible case (X, Y, or Z) 0 1 2 3 4 5
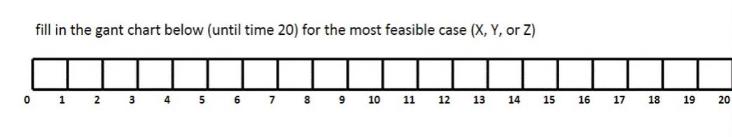
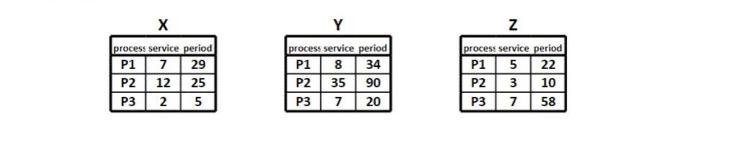
fill in the gant chart below (until time 20) for the most feasible case (X, Y, or Z) 0 1 2 3 4 5 6 7 8 00 9 10 11 12 13 14 15 16 17 18 19 20 X process service period P1 7 29 25 P2 12 25 P3 2 Y process service period 8 34 P1 P2 35 90 P3 7 20 Z process service period P1 5 22 P2 10 P3 58 537 3
Step by Step Solution
3.45 Rating (148 Votes )
There are 3 Steps involved in it
To create the Gantt chart we need to apply the Rate Monotonic Scheduling RMS algorithm In RMS the process with the shortest period ie the highest priority is assigned to the processor first If two pro... View full answer

Get step-by-step solutions from verified subject matter experts