

Question: Fill-up the Frequency Table using the data set below. Then, get the mean, variance and standard deviation of both population and sample. Answer the following:
Fill-up the Frequency Table using the data set below. Then, get the mean, variance and standard deviation of both population and sample.
Answer the following:
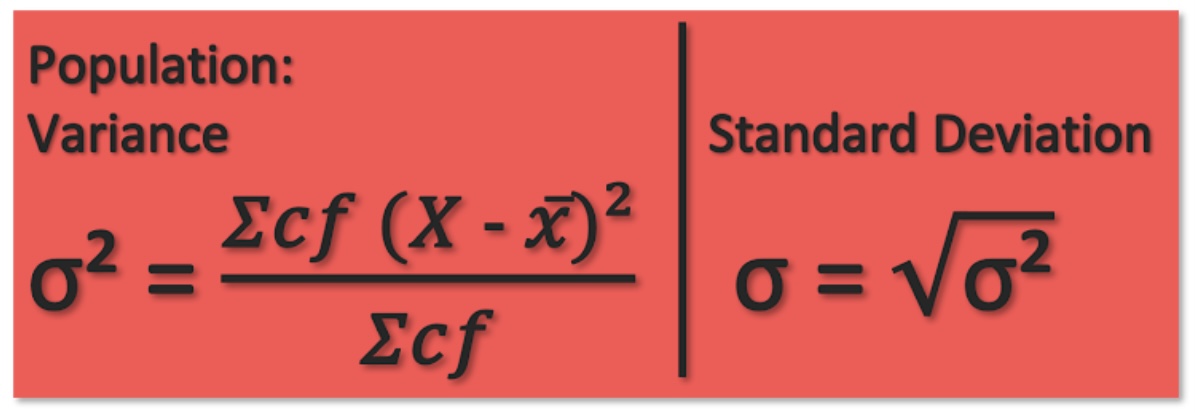
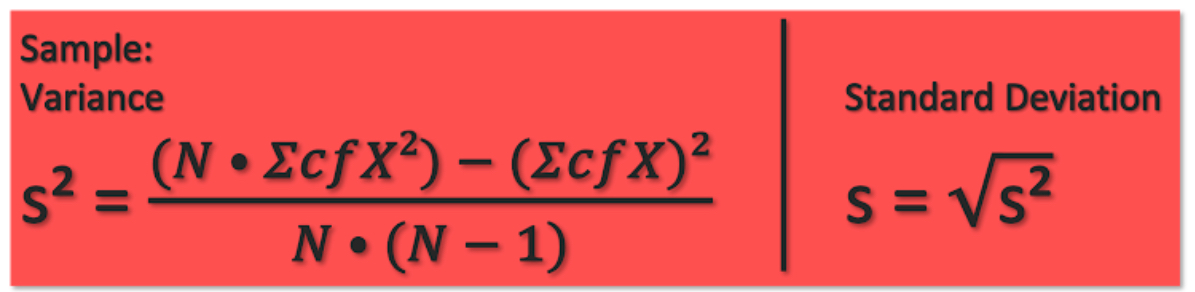
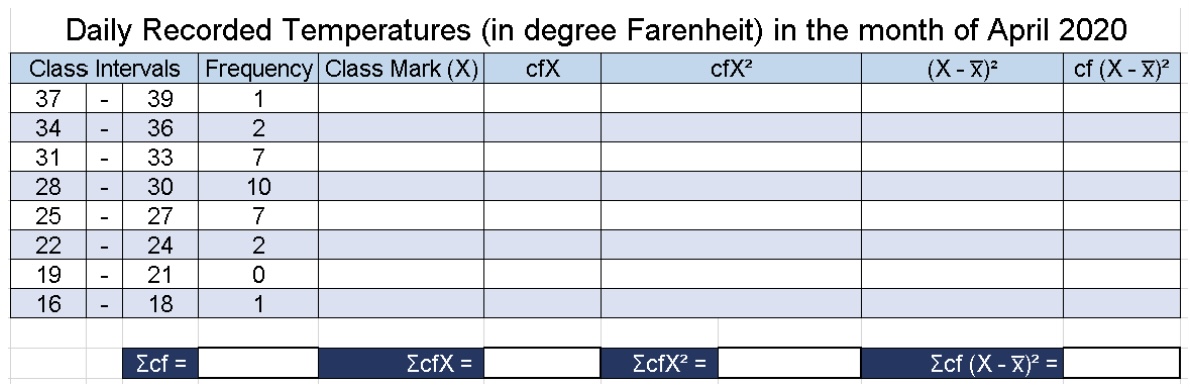
\fSample: Variance Standard Deviation 2 (N . Ecfx2) - (EcfX)2 S VS2 N . (N- 1)Daily Recorded Temperatures (in degree Farenheit) in the month of April 2020 Class Intervals Frequency Class Mark (X) cfX cfX2 (X - X ) 2 cf (X - X)2 37 39 1 34 36 2 31 33 7 28 30 10 25 27 7 22 24 2 19 21 0 16 18 1 Ecf = EcfX = EcfX? = Ecf (X - X) =
Step by Step Solution
There are 3 Steps involved in it
1 Expert Approved Answer
Step: 1 Unlock

Question Has Been Solved by an Expert!
Get step-by-step solutions from verified subject matter experts
Step: 2 Unlock
Step: 3 Unlock