

Question: Final Project Part 2: EXCEL TABLE AND RELATED QUESTIONS Instructions Cut and Paste your EXCEL TABLE into this document on the Top It will fit
Final Project Part 2:
EXCEL TABLE AND RELATED QUESTIONS
Instructions
- Cut and Paste your EXCEL TABLE into this document on the Top
- It will fit perfectly if you decrease the font size
- Use the information form the table to answer most questions. Some questions require economic thinking.
- In order to complete the excel file for analysis you will need this information:
- The market this firm is producing in is highly competitive. The current Market Price is $25.00. The Total Fixed Cost for the Company is $10.00 per week.
- Word process your answer right into this document.
2.1 At zero units of output what are the Total Costs? ___________ (make sure you have this cell filled in on the excel file document). This cost represents the ___________________________ of the firm.
2.2 The profit maximizing/loss minimizing revenue for this firm is: __________________.
2.3 At the profit maximizing/loss minimizing level of output the MC is _______ and the MR is ___________.
2.4 Assuming the firm produces and sells whole units of output briefly explain if this is the correct level of output and why.
2.5 At what level of output does the reflection of diminishing marginal product set in? ________ ?
2.6 What cost do you look at to determine the number? _________________. Explain.
2.7 Is it likely that this firm would price discriminate? Explain
2.8 Would this firm benefit from advertising? Explain
2.9 If the price fell to $5.00 because of a decrease in demand as the result of Covid 19 what would the profit maximizing output be? _________________ .
2.10 On your excel table shade in the row (yellow) that represents the profit maximizing Q and costs associated with a price of $5
2.11 Would the firm stay open? Briefly explain why of why not.
2.12 If all but two firms leave the market because of Covid 19 can the remaining firms become an Oligopoly? Briefly explain your answer.
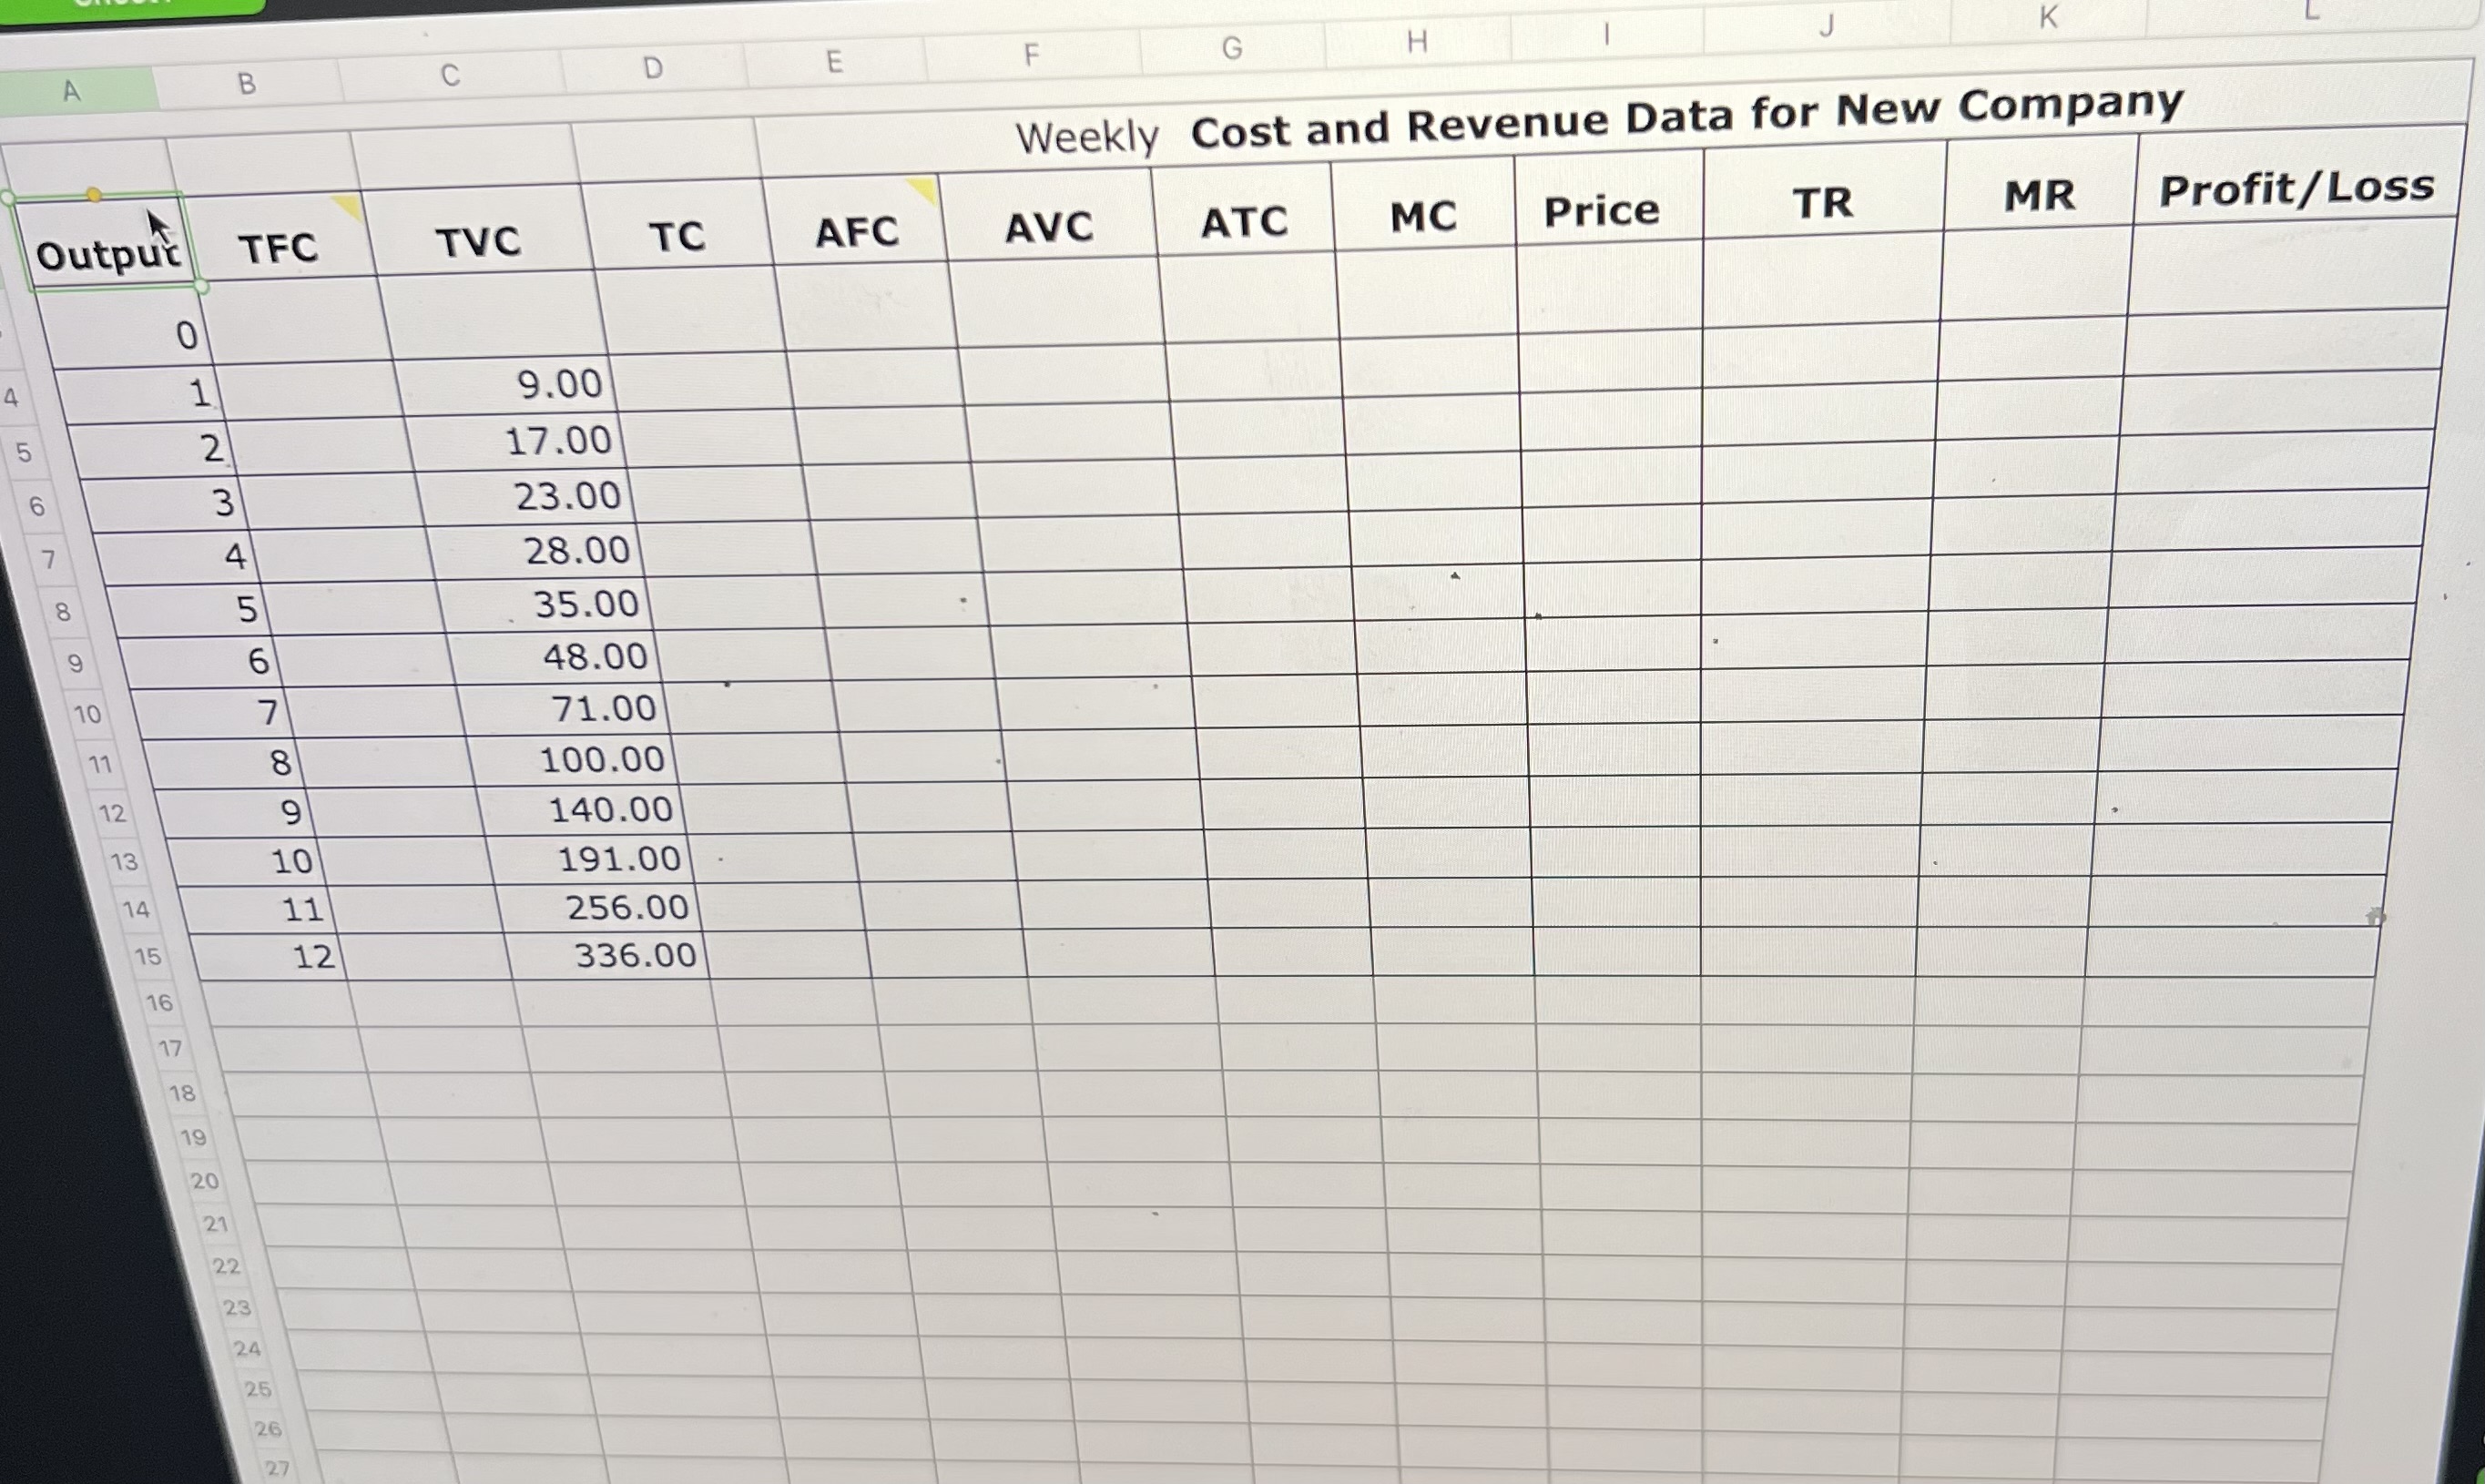
A B C D E F G H K Weekly Cost and Revenue Data for New Company Output TFC TVC TC AFC AVC ATC MC Price TR MR Profit/ Loss O 4 9.00 2 17.00 23.00 V 4 28.00 00 35.00 48.00 71.00 100.00 9 140.00 13 10 191.00 14 11 256.00 15 12 336.00 16 17 24 25 26 N
Step by Step Solution
There are 3 Steps involved in it

Get step-by-step solutions from verified subject matter experts