

Below are ratios with explanations introduced in this chapter. See Appendix B for additional ratios . Financial
Question:
Below are ratios with explanations introduced in this chapter. See Appendix B for additional ratios.
Financial Leverage is similar to the debt ratio, in the sense that the more debt a company has, the higher the Financial Leverage. It measures how debt “boosts” return on assets to increase return on equity.
![]()
The Return on Equity (ROE) ratio measures how effectively stockholders’ equity is used to produce net income. ROA x Financial Leverage = ROE
![]()
Times Interest Earned indicates a company’s ability to earn (cover) its periodic interest payments.
![]()
Earnings per Share (EPS) is the amount of net income (loss) earned by each individual share of stock held by investors.
![]()
The Dividend Rate is the amount of dividends paid annually for each share of stock held by investors.
![]()
Investors use the Price Earnings (PE) ratio to measure how “expensive” a company’s stock is compared to EPS. Regrettably, it does not explain why a stock is expensive or cheap.
![]()
Below are ratios and selected financial information for three companies within the Retail Apparel industry: American Eagle Outfitters, Inc. (AEO), GAP Inc. (GPS), and Urban Outfitters Inc.(URBN).
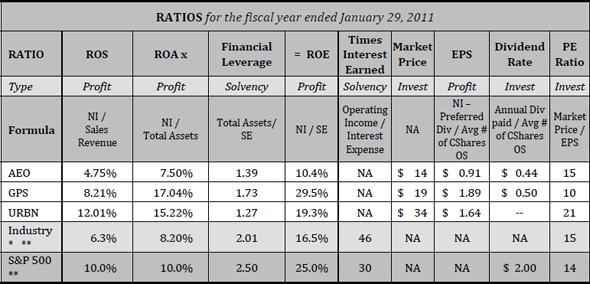
* Industry Averages for Apparel Stores—Industry and S&P 500 ratio averages from moneycentral.msn.com
** There are no official rules governing how these ratios are calculated. Therefore, the ratio formulas used may differ from the formulas in the text.
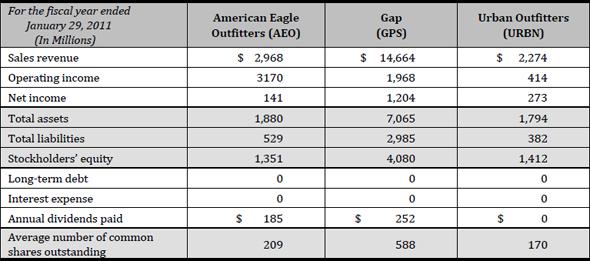
Refer to the ratios and selected financial information for three companies within the Retail Apparel Industry: American Eagle Outfitters, Inc. (AEO), GAP Inc. (GPS), and Urban Outfitters Inc. on the previous page to answer the following questions.
1 The strongest ROS ratio is reported by (AEO / GPS / URBN). ROS expresses net income as a percentage of (revenue / expenses / assets) and measures the firm’s ability to control (revenue / expenses / net income) to keep (revenue / expenses / net income) high.
2 Meaning is added to a ratio by comparing it to industry norms because success may vary by industry. An ROA ratio greater than the industry norm is reported by (AEO / GPS / URBN), indicating these companies have (greater / less) overall profitability than average within the Apparel Store Industry.
3 The greatest financial leverage ratio of __________ is reported by (AEO / GPS / URBN), which will boost ROA almost (1 / 2 / 4) times to increase (ROS / ROE / EPS / PE). The average Financial Leverage for the S&P 500 is (higher / lower) than the average for the Apparel Store Industry, indicating that the S&P 500 stocks carry (more / less) debt on average than the Apparel Store Industry.
4 The strongest ROE is reported by (AEO / GPS / URBN), with ROA contributing 17% to ROE and Financial Leverage contributing _____% to ROE. Therefore, (ROA / Financial Leverage) is the primary driver of ROE.
5 A Times Interest Earned ratio greater than 4 generally indicates the ability to make interest payments. Companies within the Apparel Store Industry, on average, (have/don’t have) the ability to make interest payments.
6 The higher EPS is reported by (AEO / URBN), indicating (AEO / URBN / can’t tell) is more profitable. EPS (does/does not) compare profitability among companies, but (does/does not) reflect shareholders’ proportionate share of earnings.
7 The companies paying dividends are (AEO / GPS / URBN). AEO is paying out approximately (25% / 50% / 75%) of this year’s EPS. The dividend rate of AEO is (more / less) than the average for the S&P 500.
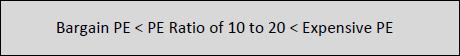
8 Urban Outfitter’s PE Ratio of __________ indicates there is $__________ of market price for each $1 of EPS. As measured by the PE ratio, (AEO / GPS / URBN) stock is the most expensive. Using the PE ratio scale immediately above, AEO has (bargain-priced / moderately-priced / expensive) stock when compared to EPS. A higher PE ratio indicates (superior / inferior / can’t tell) stock.
9 Overall, which company has the greatest profitability? (AEO / GPS / URBN) How can you tell?
Which company is assuming the greatest financial risk? (AEO / GPS / URBN) How can you tell?
Which company would you invest in? (AEO / GPS / URBN) Why?
Expert Answer:
Statement of shareholders equity This statement provides information about the changing shareholders equity of the company The shareholders equity includes the retained earnings and contributed capita... View the full answer


Foundations in Microbiology
ISBN: 978-0073375298
8th edition
Authors: Kathleen Park Talaro, Barry Chess
