

Question: Financial Statement Assignment #2 Instructions for Phase C: Use your graded financial statements (from Phase B of this assignment) to prepare a ratio analysis
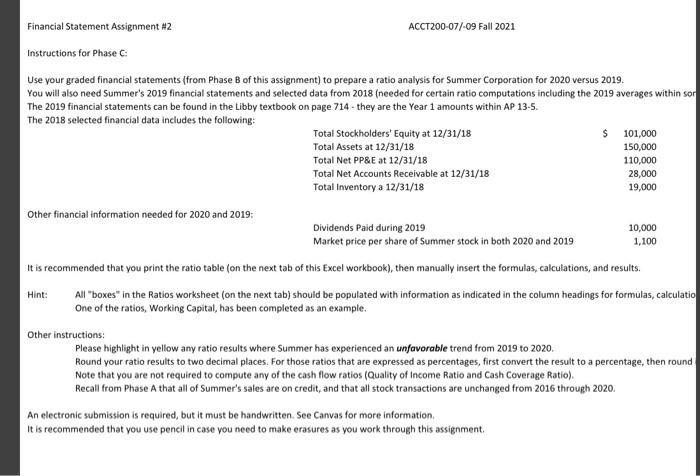
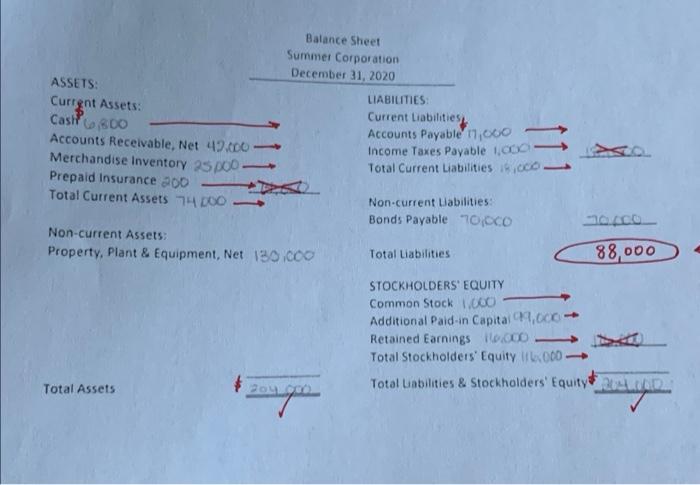
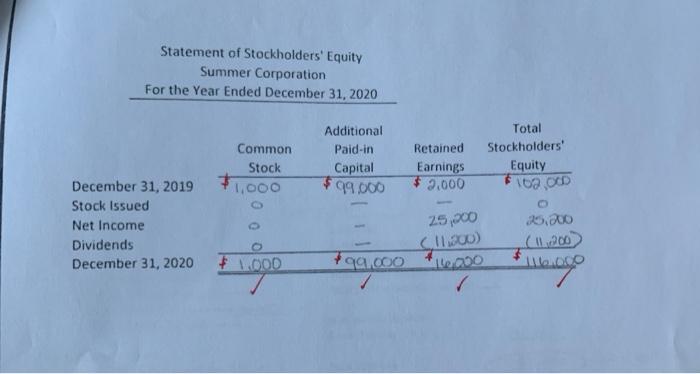
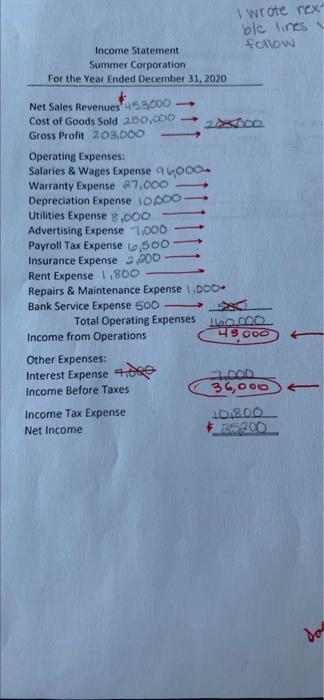
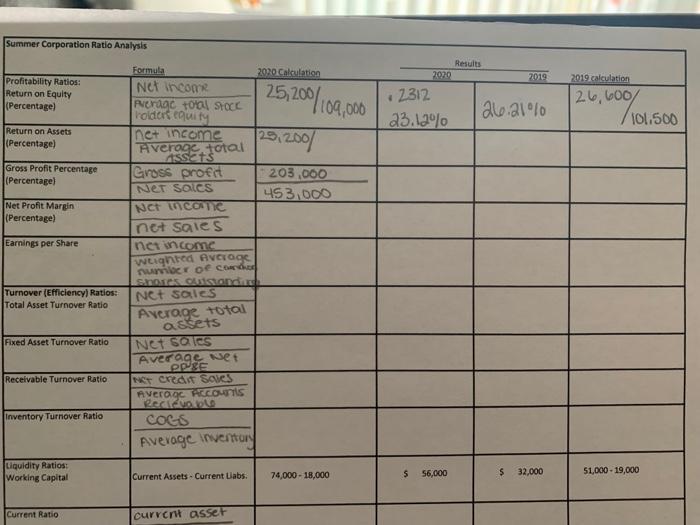
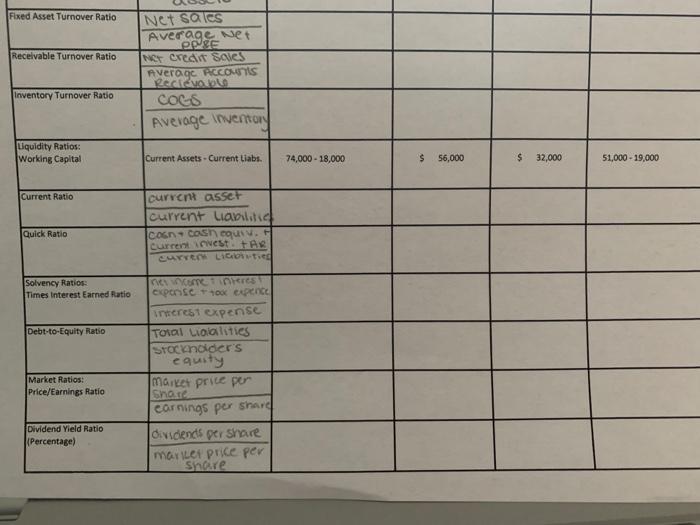
Financial Statement Assignment #2 Instructions for Phase C: Use your graded financial statements (from Phase B of this assignment) to prepare a ratio analysis for Summer Corporation for 2020 versus 2019. You will also need Summer's 2019 financial statements and selected data from 2018 (needed for certain ratio computations including the 2019 averages within sor The 2019 financial statements can be found in the Libby textbook on page 714- they are the Year 1 amounts within AP 13-5. The 2018 selected financial data includes the following: Other financial information needed for 2020 and 2019: Hint: ACCT200-07/-09 Fall 2021 Other instructions: Total Stockholders' Equity at 12/31/18 Total Assets at 12/31/18 Total Net PP&E at 12/31/18 Total Net Accounts Receivable at 12/31/18 Total Inventory a 12/31/18 Dividends Paid during 2019 Market price per share of Summer stock in both 2020 and 2019 It is recommended that you print the ratio table (on the next tab of this Excel workbook), then manually insert the formulas, calculations, and results. All "boxes" in the Ratios worksheet (on the next tab) should be populated with information as indicated in the column headings for formulas, calculatio One of the ratios, Working Capital, has been completed as an example. $ 101,000 150,000 110,000 28,000 19,000 An electronic submission is required, but it must be handwritten. See Canvas for more information. It is recommended that you use pencil in case you need to make erasures as you work through this assignment. 10,000 1,100 Please highlight in yellow any ratio results where Summer has experienced an unfavorable trend from 2019 to 2020. Round your ratio results to two decimal places. For those ratios that are expressed as percentages, first convert the result to a percentage, then round i Note that you are not required to compute any of the cash flow ratios (Quality of Income Ratio and Cash Coverage Ratio). Recall from Phase A that all of Summer's sales are on credit, and that all stock transactions are unchanged from 2016 through 2020. ASSETS: Current Assets: Cash 800 Accounts Receivable, Net 42.000- Merchandise Inventory 25 000- Prepaid Insurance 200 Total Current Assets 74 200- Non-current Assets: Property, Plant & Equipment, Net 130.000 Total Assets Balance Sheet Summer Corporation December 31, 2020 204 LIABILITIES: Current Liabilities Accounts Payable 17,000 Income Taxes Payable 1,000 Total Current Liabilities 8,000. Non-current Liabilities: Bonds Payable 70,000 Total Liabilities 10X a 88,000 STOCKHOLDERS' EQUITY Common Stock 1,000 Additional Paid-in Capital,000- Retained Earnings 1.000 Total Stockholders' Equity if.000-> Total Liabilities & Stockholders' Equity D Statement of Stockholders' Equity Summer Corporation For the Year Ended December 31, 2020 December 31, 2019 Stock Issued Net Income Dividends December 31, 2020 Common Stock $1,000 Additional Paid-in Capital $99,000 Retained Earnings $2.000 25,000 11,200) 166,000 799,000 $1.000 Total Stockholders' Equity 102,000 $ 25,200 6.000 Income Statement Summer Corporation For the Year Ended December 31, 2020 Net Sales Revenues 453000 Cost of Goods Sold 250,000 Gross Profit 203,000 - Operating Expenses: Salaries & Wages Expense 4000 Warranty Expense 87,000 Depreciation Expense 10000- Utilities Expense 8,000 Advertising Expense 1,000 Payroll Tax Expense 6,500. Insurance Expense 200 Rent Expense 1,800 Repairs & Maintenance Expense ,DOD Bank Service Expense 500 Total Operating Expenses 10.000 Income from Operations 43,000 Other Expenses: Interest Expense 4000 Income Before Taxes I wrote nex- ble lines y follow Income Tax Expense Net Income 7800 36,000 10.800 25300 do Summer Corporation Ratio Analysis Profitability Ratios: Return on Equity (Percentage) Return on Assets (Percentage) Gross Profit Percentage (Percentage) Net Profit Margin (Percentage) Earnings per Share Turnover (Efficiency) Ratios: Total Asset Turnover Ratio Fixed Asset Turnover Ratio Receivable Turnover Ratio Inventory Turnover Ratio Liquidity Ratios: Working Capital Current Ratio Formula Net income Average total SHOCK holdert equity net income Average total Gross profit Net sales Net IncamC net sales net income Average total assets weighted Average number of condo shores outstanding Net sales Net sales Average Net OPSE NOT Credit Sales Average Accounts COGS Average Inventory Current Assets- Current Liabs. 2020 Calculation current asset 25,200/109,000 25,200/ 203,000 453,000 74,000-18,000 2020 4 2312 23.12% $ 56,000 Results 2019 calculation 26.21% 26,60% 101.500 $ 2019 32,000 51,000-19,000 Fixed Asset Turnover Ratio Receivable Turnover Ratio Inventory Turnover Ratio Liquidity Ratios: Working Capital Current Ratio Quick Ratio Solvency Ratios: Times Interest Earned Ratio Debt-to-Equity Ratio Market Ratios: Price/Earnings Ratio Dividend Yield Ratio (Percentage) Net sales Average Net OPSE NCT credit Sales Average Accoun Recievable COGS Average Inventory Current Assets-Current Liabs. current asset current liabilitie con cash equiv. F Current invest. +AR currer Libritied net income interest experise + tax expence interest expense Total Liaialities Stockholder's equity market price per Share earnings per share dividends per share market price per share 74,000 -18,000 $ 56,000 $ 32,000 51,000-19,000
Step by Step Solution
3.42 Rating (155 Votes )
There are 3 Steps involved in it
Step 1 Ratio Analysis It is the relationship between the two or more items of the financial statements which tells profitability liquidity activity an... View full answer

Get step-by-step solutions from verified subject matter experts