

Financial Statements Analysis of A COMPANY The purpose of most financial statement analyses is to reduce...
Fantastic news! We've Found the answer you've been seeking!
Question:
Transcribed Image Text:
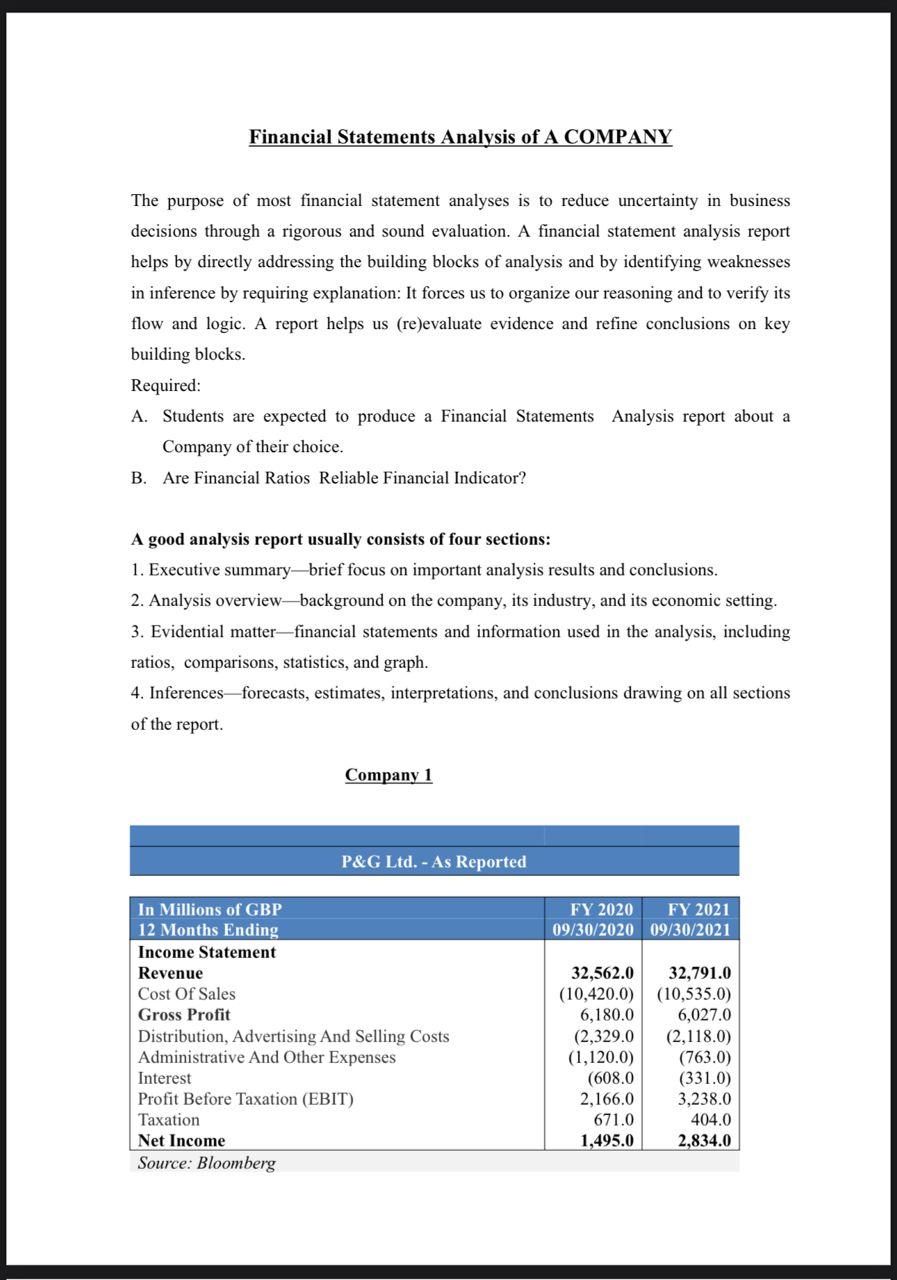
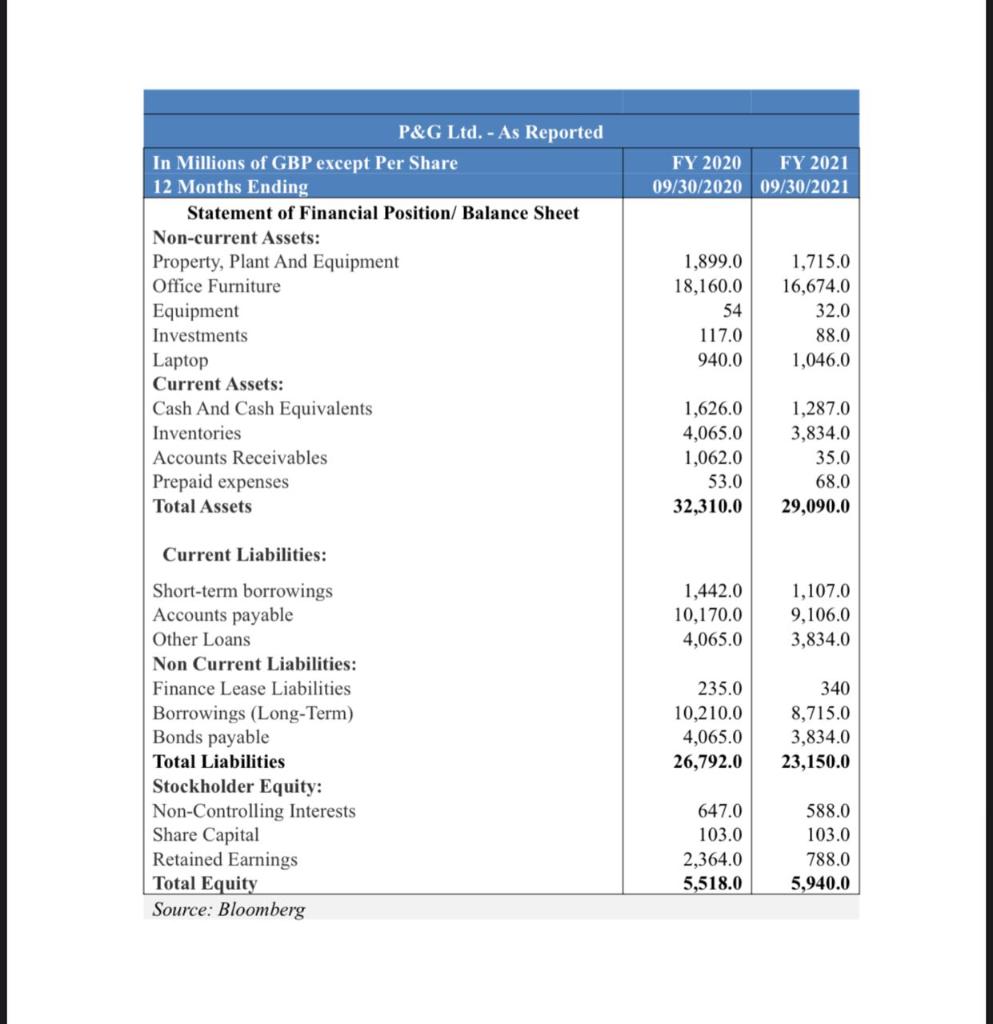
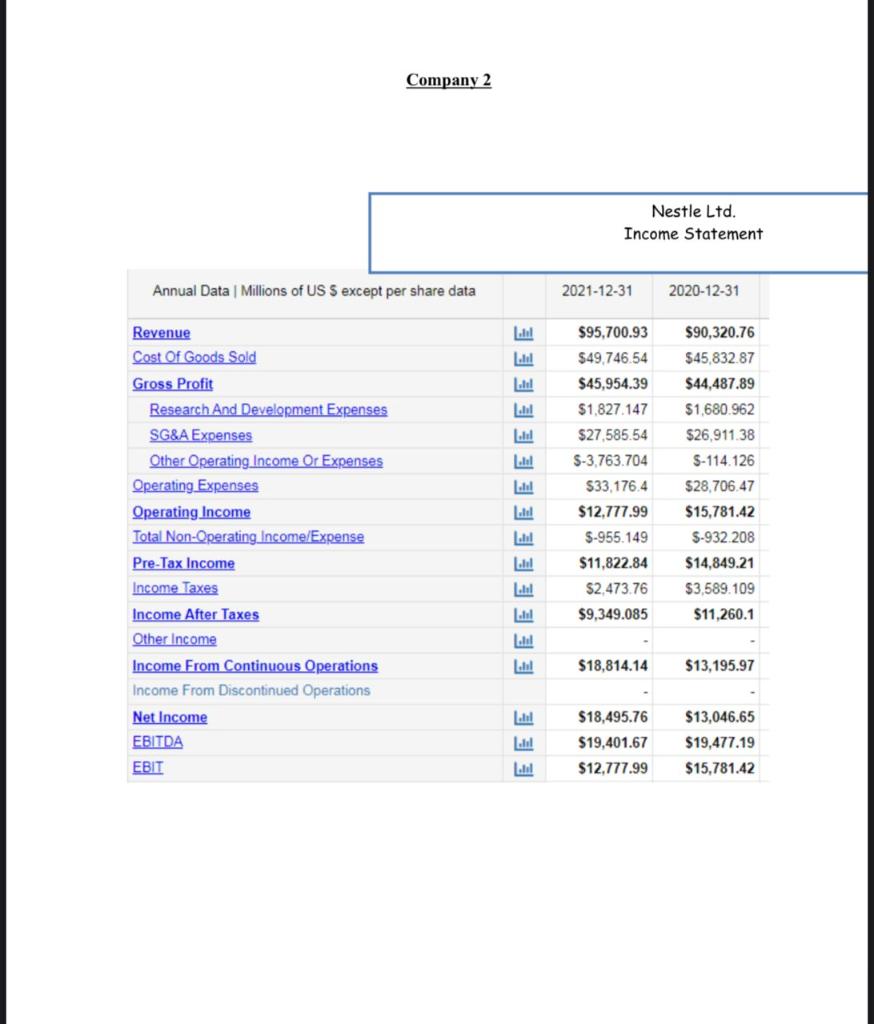
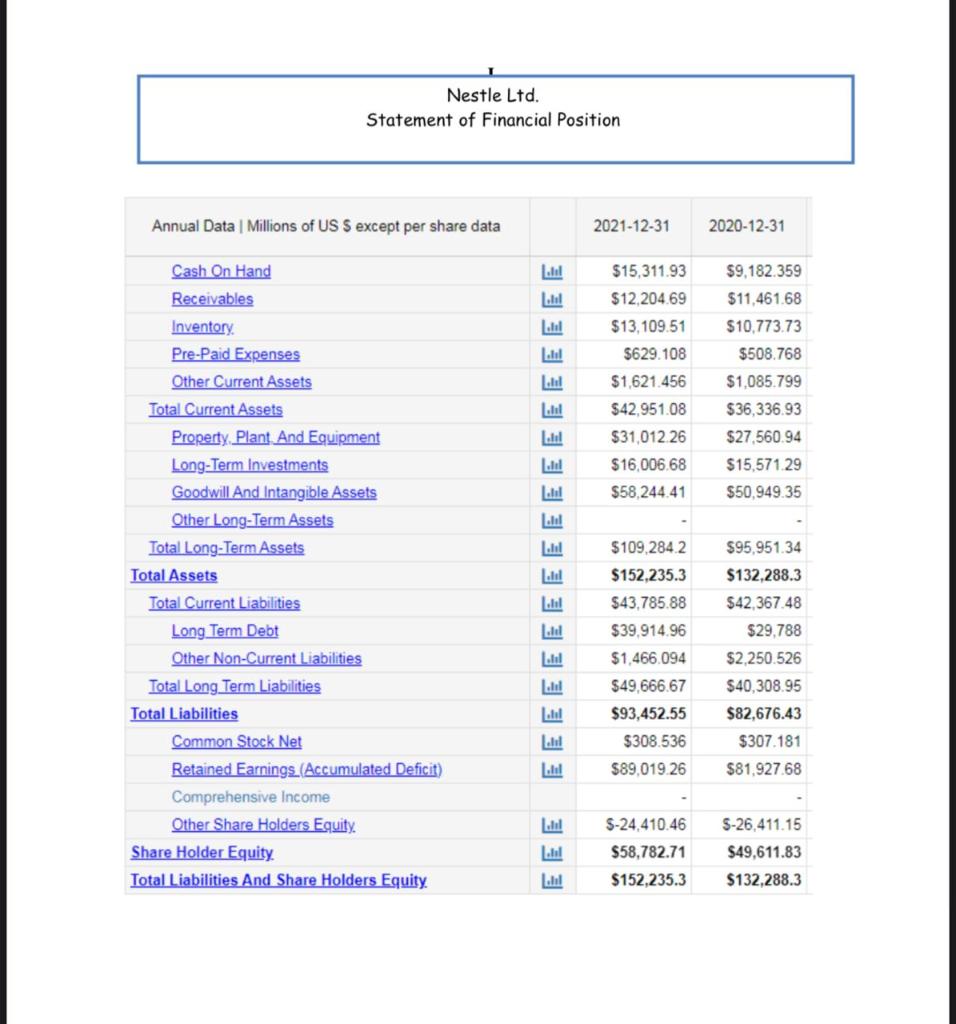
Financial Statements Analysis of A COMPANY The purpose of most financial statement analyses is to reduce uncertainty in business decisions through a rigorous and sound evaluation. A financial statement analysis report helps by directly addressing the building blocks of analysis and by identifying weaknesses in inference by requiring explanation: It forces us to organize our reasoning and to verify its flow and logic. A report helps us (re)evaluate evidence and refine conclusions on key building blocks. Required: A. Students are expected to produce a Financial Statements Analysis report about a Company of their choice. B. Are Financial Ratios Reliable Financial Indicator? A good analysis report usually consists of four sections: 1. Executive summary brief focus on important analysis results and conclusions. 2. Analysis overview background on the company, its industry, and its economic setting. 3. Evidential matter financial statements and information used in the analysis, including ratios, comparisons, statistics, and graph. 4. Inferences forecasts, estimates, interpretations, and conclusions drawing on all sections of the report. In Millions of GBP 12 Months Ending Income Statement Revenue Cost Of Sales Gross Profit Company 1 P&G Ltd. - As Reported Distribution, Advertising And Selling Costs Administrative And Other Expenses Net Income Source: Bloomberg Interest Profit Before Taxation (EBIT) Taxation FY 2020 09/30/2020 FY 2021 09/30/2021 32,562.0 32,791.0 (10,420.0) (10,535.0) 6,180.0 6,027.0 (2,329.0 (2,118.0) (1,120.0) (608.0 2,166.0 671.0 1,495.0 (763.0) (331.0) 3,238.0 404.0 2,834.0 In Millions of GBP except Per Share 12 Months Ending Statement of Financial Position/ Balance Sheet Non-current Assets: Property, Plant And Equipment Office Furniture Equipment Investments Laptop Current Assets: Cash And Cash Equivalents Inventories Accounts Receivables Prepaid expenses Total Assets Current Liabilities: Short-term borrowings Accounts payable Other Loans Non Current Liabilities: Finance Lease Liabilities Borrowings (Long-Term) Bonds payable Total Liabilities P&G Ltd. - As Reported Stockholder Equity: Non-Controlling Interests Share Capital Retained Earnings Total Equity Source: Bloomberg FY 2020 09/30/2020 1,899.0 18,160.0 54 117.0 940.0 1,626.0 4,065.0 1,062.0 53.0 32,310.0 1,442.0 10,170.0 4,065.0 647.0 103.0 FY 2021 09/30/2021 2,364.0 5,518.0 1,715.0 16,674.0 32.0 88.0 1,046.0 1,287.0 3,834.0 35.0 68.0 29,090.0 235.0 340 10,210.0 8,715.0 4,065.0 3,834.0 26,792.0 23,150.0 1,107.0 9,106.0 3,834.0 588.0 103.0 788.0 5,940.0 Annual Data | Millions of US $ except per share data Revenue Cost Of Goods Sold Gross Profit Research And Development Expenses SG&A Expenses Other Operating Income Or Expenses Operating Expenses Operating Income Total Non-Operating Income/Expense Pre-Tax Income Income Taxes Income After Taxes Other Income Company 2 Income From Continuous Operations Income From Discontinued Operations Net Income EBITDA EBIT Labl Ll Labd امام Label Labd Lad امل Label Labl Labl EE EEE Nestle Ltd. Income Statement 2021-12-31 $95,700.93 $49,746.54 $45,954.39 $1,827.147 $27,585.54 $-3,763.704 $33,176.4 $12,777.99 $-955.149 $11,822.84 $2,473.76 $9,349.085 $18,814.14 $18,495.76 $19,401.67 $12.777.99 2020-12-31 $90,320.76 $45,832.87 $44,487.89 $1,680.962 $26,911.38 S-114.126 $28,706.47 $15,781.42 $-932.208 $14,849.21 $3,589.109 $11,260.1 $13,195.97 $13,046.65 $19,477.19 $15,781.42 Annual Data | Millions of US S except per share data Cash On Hand Receivables Inventory. Pre-Paid Expenses Other Current Assets Total Current Assets Property Plant And Equipment Long-Term Investments Goodwill And Intangible Assets Other Long-Term Assets Total Long-Term Assets Total Assets Total Current Liabilities Long Term Debt Other Non-Current Liabilities Total Long Term Liabilities Nestle Ltd. Statement of Financial Position Total Liabilities Common Stock Net Retained Earnings (Accumulated Deficit) Comprehensive Income Other Share Holders Equity Share Holder Equity. Total Liabilities And Share Holders Equity d chl اس Lahd Labd L.bl bl Ladd Labl chl bl Lbl EEE 2021-12-31 $15,311.93 $12,204.69 $13,109.51 $629.108 $1,621.456 $42,951.08 $31,012.26 $16,006.68 $58,244.41 $109,284.2 $152,235.3 $43,785.88 $39,914.96 $1,466.094 $49,666.67 $93,452.55 $308.536 $89,019.26 $-24,410.46 $58,782.71 $152,235.3 2020-12-31 $9,182.359 $11,461.68 $10,773.73 $508.768 $1,085.799 $36,336.93 $27,560.94 $15,571.29 $50,949.35 $95,951.34 $132,288.3 $42,367.48 $29,788 $2,250.526 $40,308.95 $82,676.43 $307.181 $81,927.68 $-26,411.15 $49,611.83 $132,288.3 Guide lines: Financial Statements Analysis must be carried out for the most required two financial year ends. Financial Statements Analysis report must satisfy a minimum of 1500- word count and presented in a word document file. Look up the company you are trying to analysis on any finance data base so you can get a detailed description and industry classification of the business. Financial Statements Analysis of A COMPANY The purpose of most financial statement analyses is to reduce uncertainty in business decisions through a rigorous and sound evaluation. A financial statement analysis report helps by directly addressing the building blocks of analysis and by identifying weaknesses in inference by requiring explanation: It forces us to organize our reasoning and to verify its flow and logic. A report helps us (re)evaluate evidence and refine conclusions on key building blocks. Required: A. Students are expected to produce a Financial Statements Analysis report about a Company of their choice. B. Are Financial Ratios Reliable Financial Indicator? A good analysis report usually consists of four sections: 1. Executive summary brief focus on important analysis results and conclusions. 2. Analysis overview background on the company, its industry, and its economic setting. 3. Evidential matter-financial statements and information used in the analysis, including ratios, comparisons, statistics, and graph. 4. Inferences forecasts, estimates, interpretations, and conclusions drawing on all sections of the report. In Millions of GBP 12 Months Ending Income Statement Revenue Cost Of Sales Gross Profit Company 1 P&G Ltd. - As Reported Distribution, Advertising And Selling Costs Administrative And Other Expenses Net Income Source: Bloomberg Interest Profit Before Taxation (EBIT) Taxation FY 2020 09/30/2020 FY 2021 09/30/2021 32,562.0 32,791.0 (10,420.0) (10,535.0) 6,180.0 6,027.0 (2,329.0 (2,118.0) (1,120.0) (608.0 2,166.0 671.0 1,495.0 (763.0) (331.0) 3,238.0 404.0 2,834.0 In Millions of GBP except Per Share 12 Months Ending Statement of Financial Position/ Balance Sheet Non-current Assets: Property, Plant And Equipment Office Furniture Equipment Investments Laptop Current Assets: Cash And Cash Equivalents Inventories Accounts Receivables Prepaid expenses Total Assets Current Liabilities: Short-term borrowings Accounts payable Other Loans Non Current Liabilities: Finance Lease Liabilities Borrowings (Long-Term) Bonds payable Total Liabilities P&G Ltd. - As Reported Stockholder Equity: Non-Controlling Interests Share Capital Retained Earnings Total Equity Source: Bloomberg FY 2020 09/30/2020 1,899.0 18,160.0 54 117.0 940.0 1,626.0 4,065.0 1,062.0 53.0 32,310.0 1,442.0 10,170.0 4,065.0 647.0 103.0 FY 2021 09/30/2021 2,364.0 5,518.0 1,715.0 16,674.0 32.0 88.0 1,046.0 1,287.0 3,834.0 35.0 68.0 29,090.0 235.0 340 10,210.0 8,715.0 4,065.0 3,834.0 26,792.0 23,150.0 1,107.0 9,106.0 3,834.0 588.0 103.0 788.0 5,940.0 Annual Data | Millions of US $ except per share data Revenue Cost Of Goods Sold Gross Profit Research And Development Expenses SG&A Expenses Other Operating Income Or Expenses Operating Expenses Operating Income Total Non-Operating Income/Expense Pre-Tax Income Income Taxes Income After Taxes Other Income Company 2 Income From Continuous Operations Income From Discontinued Operations Net Income EBITDA EBIT Labl Ll Labd امام Label Labd Lad امل Label Labl Labl EE EEE Nestle Ltd. Income Statement 2021-12-31 $95,700.93 $49,746.54 $45,954.39 $1,827.147 $27,585.54 $-3,763.704 $33,176.4 $12,777.99 $-955.149 $11,822.84 $2,473.76 $9,349.085 $18,814.14 $18,495.76 $19,401.67 $12.777.99 2020-12-31 $90,320.76 $45,832.87 $44,487.89 $1,680.962 $26,911.38 S-114.126 $28,706.47 $15,781.42 $-932.208 $14,849.21 $3,589.109 $11,260.1 $13,195.97 $13,046.65 $19,477.19 $15,781.42 Annual Data | Millions of US S except per share data Cash On Hand Receivables Inventory. Pre-Paid Expenses Other Current Assets Total Current Assets Property Plant And Equipment Long-Term Investments Goodwill And Intangible Assets Other Long-Term Assets Total Long-Term Assets Total Assets Total Current Liabilities Long Term Debt Other Non-Current Liabilities Total Long Term Liabilities Nestle Ltd. Statement of Financial Position Total Liabilities Common Stock Net Retained Earnings (Accumulated Deficit) Comprehensive Income Other Share Holders Equity Share Holder Equity. Total Liabilities And Share Holders Equity d chl اس Lahd Labd L.bl bl Ladd Labl chl bl Lbl EEE 2021-12-31 $15,311.93 $12,204.69 $13,109.51 $629.108 $1,621.456 $42,951.08 $31,012.26 $16,006.68 $58,244.41 $109,284.2 $152,235.3 $43,785.88 $39,914.96 $1,466.094 $49,666.67 $93,452.55 $308.536 $89,019.26 $-24,410.46 $58,782.71 $152,235.3 2020-12-31 $9,182.359 $11,461.68 $10,773.73 $508.768 $1,085.799 $36,336.93 $27,560.94 $15,571.29 $50,949.35 $95,951.34 $132,288.3 $42,367.48 $29,788 $2,250.526 $40,308.95 $82,676.43 $307.181 $81,927.68 $-26,411.15 $49,611.83 $132,288.3 Guide lines: Financial Statements Analysis must be carried out for the most required two financial year ends. Financial Statements Analysis report must satisfy a minimum of 1500- word count and presented in a word document file. Look up the company you are trying to analysis on any finance data base so you can get a detailed description and industry classification of the business. Financial Statements Analysis of A COMPANY The purpose of most financial statement analyses is to reduce uncertainty in business decisions through a rigorous and sound evaluation. A financial statement analysis report helps by directly addressing the building blocks of analysis and by identifying weaknesses in inference by requiring explanation: It forces us to organize our reasoning and to verify its flow and logic. A report helps us (re)evaluate evidence and refine conclusions on key building blocks. Required: A. Students are expected to produce a Financial Statements Analysis report about a Company of their choice. B. Are Financial Ratios Reliable Financial Indicator? A good analysis report usually consists of four sections: 1. Executive summary brief focus on important analysis results and conclusions. 2. Analysis overview background on the company, its industry, and its economic setting. 3. Evidential matter-financial statements and information used in the analysis, including ratios, comparisons, statistics, and graph. 4. Inferences forecasts, estimates, interpretations, and conclusions drawing on all sections of the report. In Millions of GBP 12 Months Ending Income Statement Revenue Cost Of Sales Gross Profit Company 1 P&G Ltd. - As Reported Distribution, Advertising And Selling Costs Administrative And Other Expenses Net Income Source: Bloomberg Interest Profit Before Taxation (EBIT) Taxation FY 2020 09/30/2020 FY 2021 09/30/2021 32,562.0 32,791.0 (10,420.0) (10,535.0) 6,180.0 6,027.0 (2,329.0 (2,118.0) (1,120.0) (608.0 2,166.0 671.0 1,495.0 (763.0) (331.0) 3,238.0 404.0 2,834.0 In Millions of GBP except Per Share 12 Months Ending Statement of Financial Position/ Balance Sheet Non-current Assets: Property, Plant And Equipment Office Furniture Equipment Investments Laptop Current Assets: Cash And Cash Equivalents Inventories Accounts Receivables Prepaid expenses Total Assets Current Liabilities: Short-term borrowings Accounts payable Other Loans Non Current Liabilities: Finance Lease Liabilities Borrowings (Long-Term) Bonds payable Total Liabilities P&G Ltd. - As Reported Stockholder Equity: Non-Controlling Interests Share Capital Retained Earnings Total Equity Source: Bloomberg FY 2020 09/30/2020 1,899.0 18,160.0 54 117.0 940.0 1,626.0 4,065.0 1,062.0 53.0 32,310.0 1,442.0 10,170.0 4,065.0 647.0 103.0 FY 2021 09/30/2021 2,364.0 5,518.0 1,715.0 16,674.0 32.0 88.0 1,046.0 1,287.0 3,834.0 35.0 68.0 29,090.0 235.0 340 10,210.0 8,715.0 4,065.0 3,834.0 26,792.0 23,150.0 1,107.0 9,106.0 3,834.0 588.0 103.0 788.0 5,940.0 Annual Data | Millions of US $ except per share data Revenue Cost Of Goods Sold Gross Profit Research And Development Expenses SG&A Expenses Other Operating Income Or Expenses Operating Expenses Operating Income Total Non-Operating Income/Expense Pre-Tax Income Income Taxes Income After Taxes Other Income Company 2 Income From Continuous Operations Income From Discontinued Operations Net Income EBITDA EBIT Labl Ll Labd امام Label Labd Lad امل Label Labl Labl EE EEE Nestle Ltd. Income Statement 2021-12-31 $95,700.93 $49,746.54 $45,954.39 $1,827.147 $27,585.54 $-3,763.704 $33,176.4 $12,777.99 $-955.149 $11,822.84 $2,473.76 $9,349.085 $18,814.14 $18,495.76 $19,401.67 $12.777.99 2020-12-31 $90,320.76 $45,832.87 $44,487.89 $1,680.962 $26,911.38 S-114.126 $28,706.47 $15,781.42 $-932.208 $14,849.21 $3,589.109 $11,260.1 $13,195.97 $13,046.65 $19,477.19 $15,781.42 Annual Data | Millions of US S except per share data Cash On Hand Receivables Inventory. Pre-Paid Expenses Other Current Assets Total Current Assets Property Plant And Equipment Long-Term Investments Goodwill And Intangible Assets Other Long-Term Assets Total Long-Term Assets Total Assets Total Current Liabilities Long Term Debt Other Non-Current Liabilities Total Long Term Liabilities Nestle Ltd. Statement of Financial Position Total Liabilities Common Stock Net Retained Earnings (Accumulated Deficit) Comprehensive Income Other Share Holders Equity Share Holder Equity. Total Liabilities And Share Holders Equity d chl اس Lahd Labd L.bl bl Ladd Labl chl bl Lbl EEE 2021-12-31 $15,311.93 $12,204.69 $13,109.51 $629.108 $1,621.456 $42,951.08 $31,012.26 $16,006.68 $58,244.41 $109,284.2 $152,235.3 $43,785.88 $39,914.96 $1,466.094 $49,666.67 $93,452.55 $308.536 $89,019.26 $-24,410.46 $58,782.71 $152,235.3 2020-12-31 $9,182.359 $11,461.68 $10,773.73 $508.768 $1,085.799 $36,336.93 $27,560.94 $15,571.29 $50,949.35 $95,951.34 $132,288.3 $42,367.48 $29,788 $2,250.526 $40,308.95 $82,676.43 $307.181 $81,927.68 $-26,411.15 $49,611.83 $132,288.3 Guide lines: Financial Statements Analysis must be carried out for the most required two financial year ends. Financial Statements Analysis report must satisfy a minimum of 1500- word count and presented in a word document file. Look up the company you are trying to analysis on any finance data base so you can get a detailed description and industry classification of the business. Financial Statements Analysis of A COMPANY The purpose of most financial statement analyses is to reduce uncertainty in business decisions through a rigorous and sound evaluation. A financial statement analysis report helps by directly addressing the building blocks of analysis and by identifying weaknesses in inference by requiring explanation: It forces us to organize our reasoning and to verify its flow and logic. A report helps us (re)evaluate evidence and refine conclusions on key building blocks. Required: A. Students are expected to produce a Financial Statements Analysis report about a Company of their choice. B. Are Financial Ratios Reliable Financial Indicator? A good analysis report usually consists of four sections: 1. Executive summary brief focus on important analysis results and conclusions. 2. Analysis overview-background on the company, its industry, and its economic setting. 3. Evidential matter financial statements and information used in the analysis, including ratios, comparisons, statistics, and graph. 4. Inferences forecasts, estimates, interpretations, and conclusions drawing on all sections of the report. In Millions of GBP 12 Months Ending Income Statement Revenue Cost Of Sales Gross Profit Company 1 P&G Ltd. - As Reported Distribution, Advertising And Selling Costs Administrative And Other Expenses Net Income Source: Bloomberg Interest Profit Before Taxation (EBIT) Taxation FY 2020 09/30/2020 FY 2021 09/30/2021 32,562.0 32,791.0 (10,420.0) (10,535.0) 6,180.0 6,027.0 (2,329.0 (2,118.0) (1,120.0) (608.0 2,166.0 671.0 1,495.0 (763.0) (331.0) 3,238.0 404.0 2,834.0 In Millions of GBP except Per Share 12 Months Ending Statement of Financial Position/ Balance Sheet Non-current Assets: Property, Plant And Equipment Office Furniture Equipment Investments Laptop Current Assets: Cash And Cash Equivalents Inventories Accounts Receivables Prepaid expenses Total Assets Current Liabilities: Short-term borrowings Accounts payable Other Loans Non Current Liabilities: Finance Lease Liabilities Borrowings (Long-Term) Bonds payable Total Liabilities P&G Ltd. - As Reported Stockholder Equity: Non-Controlling Interests Share Capital Retained Earnings Total Equity Source: Bloomberg FY 2020 09/30/2020 1,899.0 18,160.0 54 117.0 940.0 1,626.0 4,065.0 1,062.0 53.0 32,310.0 1,442.0 10,170.0 4,065.0 647.0 103.0 FY 2021 09/30/2021 2,364.0 5,518.0 1,715.0 16,674.0 32.0 88.0 1,046.0 1,287.0 3,834.0 35.0 68.0 29,090.0 235.0 340 10,210.0 8,715.0 4,065.0 3,834.0 26,792.0 23,150.0 1,107.0 9,106.0 3,834.0 588.0 103.0 788.0 5,940.0 Annual Data | Millions of US $ except per share data Revenue Cost Of Goods Sold Gross Profit Research And Development Expenses SG&A Expenses Other Operating Income Or Expenses Operating Expenses Operating Income Total Non-Operating Income/Expense Pre-Tax Income Income Taxes Income After Taxes Other Income Company 2 Income From Continuous Operations Income From Discontinued Operations Net Income EBITDA EBIT Labl Ll Labd امام Label Labd Lad امل Label Labl Labl EE EEE Nestle Ltd. Income Statement 2021-12-31 $95,700.93 $49,746.54 $45,954.39 $1,827.147 $27,585.54 $-3,763.704 $33,176.4 $12,777.99 $-955.149 $11,822.84 $2,473.76 $9,349.085 $18,814.14 $18,495.76 $19,401.67 $12.777.99 2020-12-31 $90,320.76 $45,832.87 $44,487.89 $1,680.962 $26,911.38 S-114.126 $28,706.47 $15,781.42 $-932.208 $14,849.21 $3,589.109 $11,260.1 $13,195.97 $13,046.65 $19,477.19 $15,781.42 Annual Data | Millions of US S except per share data Cash On Hand Receivables Inventory. Pre-Paid Expenses Other Current Assets Total Current Assets Property Plant And Equipment Long-Term Investments Goodwill And Intangible Assets Other Long-Term Assets Total Long-Term Assets Total Assets Total Current Liabilities Long Term Debt Other Non-Current Liabilities Total Long Term Liabilities Nestle Ltd. Statement of Financial Position Total Liabilities Common Stock Net Retained Earnings (Accumulated Deficit) Comprehensive Income Other Share Holders Equity Share Holder Equity. Total Liabilities And Share Holders Equity d chl اس Lahd Labd L.bl bl Ladd Labl chl bl Lbl EEE 2021-12-31 $15,311.93 $12,204.69 $13,109.51 $629.108 $1,621.456 $42,951.08 $31,012.26 $16,006.68 $58,244.41 $109,284.2 $152,235.3 $43,785.88 $39,914.96 $1,466.094 $49,666.67 $93,452.55 $308.536 $89,019.26 $-24,410.46 $58,782.71 $152,235.3 2020-12-31 $9,182.359 $11,461.68 $10,773.73 $508.768 $1,085.799 $36,336.93 $27,560.94 $15,571.29 $50,949.35 $95,951.34 $132,288.3 $42,367.48 $29,788 $2,250.526 $40,308.95 $82,676.43 $307.181 $81,927.68 $-26,411.15 $49,611.83 $132,288.3 Guide lines: Financial Statements Analysis must be carried out for the most required two financial year ends. Financial Statements Analysis report must satisfy a minimum of 1500- word count and presented in a word document file. Look up the company you are trying to analysis on any finance data base so you can get a detailed description and industry classification of the business. Financial Statements Analysis of A COMPANY The purpose of most financial statement analyses is to reduce uncertainty in business decisions through a rigorous and sound evaluation. A financial statement analysis report helps by directly addressing the building blocks of analysis and by identifying weaknesses in inference by requiring explanation: It forces us to organize our reasoning and to verify its flow and logic. A report helps us (re)evaluate evidence and refine conclusions on key building blocks. Required: A. Students are expected to produce a Financial Statements Analysis report about a Company of their choice. B. Are Financial Ratios Reliable Financial Indicator? A good analysis report usually consists of four sections: 1. Executive summary brief focus on important analysis results and conclusions. 2. Analysis overview background on the company, its industry, and its economic setting. 3. Evidential matter financial statements and information used in the analysis, including ratios, comparisons, statistics, and graph. 4. Inferences forecasts, estimates, interpretations, and conclusions drawing on all sections of the report. In Millions of GBP 12 Months Ending Income Statement Revenue Cost Of Sales Gross Profit Company 1 P&G Ltd. - As Reported Distribution, Advertising And Selling Costs Administrative And Other Expenses Net Income Source: Bloomberg Interest Profit Before Taxation (EBIT) Taxation FY 2020 09/30/2020 FY 2021 09/30/2021 32,562.0 32,791.0 (10,420.0) (10,535.0) 6,180.0 6,027.0 (2,329.0 (2,118.0) (1,120.0) (608.0 2,166.0 671.0 1,495.0 (763.0) (331.0) 3,238.0 404.0 2,834.0 In Millions of GBP except Per Share 12 Months Ending Statement of Financial Position/ Balance Sheet Non-current Assets: Property, Plant And Equipment Office Furniture Equipment Investments Laptop Current Assets: Cash And Cash Equivalents Inventories Accounts Receivables Prepaid expenses Total Assets Current Liabilities: Short-term borrowings Accounts payable Other Loans Non Current Liabilities: Finance Lease Liabilities Borrowings (Long-Term) Bonds payable Total Liabilities P&G Ltd. - As Reported Stockholder Equity: Non-Controlling Interests Share Capital Retained Earnings Total Equity Source: Bloomberg FY 2020 09/30/2020 1,899.0 18,160.0 54 117.0 940.0 1,626.0 4,065.0 1,062.0 53.0 32,310.0 1,442.0 10,170.0 4,065.0 647.0 103.0 FY 2021 09/30/2021 2,364.0 5,518.0 1,715.0 16,674.0 32.0 88.0 1,046.0 1,287.0 3,834.0 35.0 68.0 29,090.0 235.0 340 10,210.0 8,715.0 4,065.0 3,834.0 26,792.0 23,150.0 1,107.0 9,106.0 3,834.0 588.0 103.0 788.0 5,940.0 Annual Data | Millions of US $ except per share data Revenue Cost Of Goods Sold Gross Profit Research And Development Expenses SG&A Expenses Other Operating Income Or Expenses Operating Expenses Operating Income Total Non-Operating Income/Expense Pre-Tax Income Income Taxes Income After Taxes Other Income Company 2 Income From Continuous Operations Income From Discontinued Operations Net Income EBITDA EBIT Labl Ll Labd امام Label Labd Lad امل Label Labl Labl EE EEE Nestle Ltd. Income Statement 2021-12-31 $95,700.93 $49,746.54 $45,954.39 $1,827.147 $27,585.54 $-3,763.704 $33,176.4 $12,777.99 $-955.149 $11,822.84 $2,473.76 $9,349.085 $18,814.14 $18,495.76 $19,401.67 $12.777.99 2020-12-31 $90,320.76 $45,832.87 $44,487.89 $1,680.962 $26,911.38 S-114.126 $28,706.47 $15,781.42 $-932.208 $14,849.21 $3,589.109 $11,260.1 $13,195.97 $13,046.65 $19,477.19 $15,781.42 Annual Data | Millions of US S except per share data Cash On Hand Receivables Inventory. Pre-Paid Expenses Other Current Assets Total Current Assets Property Plant And Equipment Long-Term Investments Goodwill And Intangible Assets Other Long-Term Assets Total Long-Term Assets Total Assets Total Current Liabilities Long Term Debt Other Non-Current Liabilities Total Long Term Liabilities Nestle Ltd. Statement of Financial Position Total Liabilities Common Stock Net Retained Earnings (Accumulated Deficit) Comprehensive Income Other Share Holders Equity Share Holder Equity. Total Liabilities And Share Holders Equity d chl اس Lahd Labd L.bl bl Ladd Labl chl bl Lbl EEE 2021-12-31 $15,311.93 $12,204.69 $13,109.51 $629.108 $1,621.456 $42,951.08 $31,012.26 $16,006.68 $58,244.41 $109,284.2 $152,235.3 $43,785.88 $39,914.96 $1,466.094 $49,666.67 $93,452.55 $308.536 $89,019.26 $-24,410.46 $58,782.71 $152,235.3 2020-12-31 $9,182.359 $11,461.68 $10,773.73 $508.768 $1,085.799 $36,336.93 $27,560.94 $15,571.29 $50,949.35 $95,951.34 $132,288.3 $42,367.48 $29,788 $2,250.526 $40,308.95 $82,676.43 $307.181 $81,927.68 $-26,411.15 $49,611.83 $132,288.3 Guide lines: Financial Statements Analysis must be carried out for the most required two financial year ends. Financial Statements Analysis report must satisfy a minimum of 1500- word count and presented in a word document file. Look up the company you are trying to analysis on any finance data base so you can get a detailed description and industry classification of the business. Financial Statements Analysis of A COMPANY The purpose of most financial statement analyses is to reduce uncertainty in business decisions through a rigorous and sound evaluation. A financial statement analysis report helps by directly addressing the building blocks of analysis and by identifying weaknesses in inference by requiring explanation: It forces us to organize our reasoning and to verify its flow and logic. A report helps us (re)evaluate evidence and refine conclusions on key building blocks. Required: A. Students are expected to produce a Financial Statements Analysis report about a Company of their choice. B. Are Financial Ratios Reliable Financial Indicator? A good analysis report usually consists of four sections: 1. Executive summary brief focus on important analysis results and conclusions. 2. Analysis overview background on the company, its industry, and its economic setting. 3. Evidential matter-financial statements and information used in the analysis, including ratios, comparisons, statistics, and graph. 4. Inferences forecasts, estimates, interpretations, and conclusions drawing on all sections of the report. In Millions of GBP 12 Months Ending Income Statement Revenue Cost Of Sales Gross Profit Company 1 P&G Ltd. - As Reported Distribution, Advertising And Selling Costs Administrative And Other Expenses Net Income Source: Bloomberg Interest Profit Before Taxation (EBIT) Taxation FY 2020 09/30/2020 FY 2021 09/30/2021 32,562.0 32,791.0 (10,420.0) (10,535.0) 6,180.0 6,027.0 (2,329.0 (2,118.0) (1,120.0) (608.0 2,166.0 671.0 1,495.0 (763.0) (331.0) 3,238.0 404.0 2,834.0 In Millions of GBP except Per Share 12 Months Ending Statement of Financial Position/ Balance Sheet Non-current Assets: Property, Plant And Equipment Office Furniture Equipment Investments Laptop Current Assets: Cash And Cash Equivalents Inventories Accounts Receivables Prepaid expenses Total Assets Current Liabilities: Short-term borrowings Accounts payable Other Loans Non Current Liabilities: Finance Lease Liabilities Borrowings (Long-Term) Bonds payable Total Liabilities P&G Ltd. - As Reported Stockholder Equity: Non-Controlling Interests Share Capital Retained Earnings Total Equity Source: Bloomberg FY 2020 09/30/2020 1,899.0 18,160.0 54 117.0 940.0 1,626.0 4,065.0 1,062.0 53.0 32,310.0 1,442.0 10,170.0 4,065.0 647.0 103.0 FY 2021 09/30/2021 2,364.0 5,518.0 1,715.0 16,674.0 32.0 88.0 1,046.0 1,287.0 3,834.0 35.0 68.0 29,090.0 235.0 340 10,210.0 8,715.0 4,065.0 3,834.0 26,792.0 23,150.0 1,107.0 9,106.0 3,834.0 588.0 103.0 788.0 5,940.0 Annual Data | Millions of US $ except per share data Revenue Cost Of Goods Sold Gross Profit Research And Development Expenses SG&A Expenses Other Operating Income Or Expenses Operating Expenses Operating Income Total Non-Operating Income/Expense Pre-Tax Income Income Taxes Income After Taxes Other Income Company 2 Income From Continuous Operations Income From Discontinued Operations Net Income EBITDA EBIT Labl Ll Labd امام Label Labd Lad امل Label Labl Labl EE EEE Nestle Ltd. Income Statement 2021-12-31 $95,700.93 $49,746.54 $45,954.39 $1,827.147 $27,585.54 $-3,763.704 $33,176.4 $12,777.99 $-955.149 $11,822.84 $2,473.76 $9,349.085 $18,814.14 $18,495.76 $19,401.67 $12.777.99 2020-12-31 $90,320.76 $45,832.87 $44,487.89 $1,680.962 $26,911.38 S-114.126 $28,706.47 $15,781.42 $-932.208 $14,849.21 $3,589.109 $11,260.1 $13,195.97 $13,046.65 $19,477.19 $15,781.42 Annual Data | Millions of US S except per share data Cash On Hand Receivables Inventory. Pre-Paid Expenses Other Current Assets Total Current Assets Property Plant And Equipment Long-Term Investments Goodwill And Intangible Assets Other Long-Term Assets Total Long-Term Assets Total Assets Total Current Liabilities Long Term Debt Other Non-Current Liabilities Total Long Term Liabilities Nestle Ltd. Statement of Financial Position Total Liabilities Common Stock Net Retained Earnings (Accumulated Deficit) Comprehensive Income Other Share Holders Equity Share Holder Equity. Total Liabilities And Share Holders Equity d chl اس Lahd Labd L.bl bl Ladd Labl chl bl Lbl EEE 2021-12-31 $15,311.93 $12,204.69 $13,109.51 $629.108 $1,621.456 $42,951.08 $31,012.26 $16,006.68 $58,244.41 $109,284.2 $152,235.3 $43,785.88 $39,914.96 $1,466.094 $49,666.67 $93,452.55 $308.536 $89,019.26 $-24,410.46 $58,782.71 $152,235.3 2020-12-31 $9,182.359 $11,461.68 $10,773.73 $508.768 $1,085.799 $36,336.93 $27,560.94 $15,571.29 $50,949.35 $95,951.34 $132,288.3 $42,367.48 $29,788 $2,250.526 $40,308.95 $82,676.43 $307.181 $81,927.68 $-26,411.15 $49,611.83 $132,288.3 Guide lines: Financial Statements Analysis must be carried out for the most required two financial year ends. Financial Statements Analysis report must satisfy a minimum of 1500- word count and presented in a word document file. Look up the company you are trying to analysis on any finance data base so you can get a detailed description and industry classification of the business. Financial Statements Analysis of A COMPANY The purpose of most financial statement analyses is to reduce uncertainty in business decisions through a rigorous and sound evaluation. A financial statement analysis report helps by directly addressing the building blocks of analysis and by identifying weaknesses in inference by requiring explanation: It forces us to organize our reasoning and to verify its flow and logic. A report helps us (re)evaluate evidence and refine conclusions on key building blocks. Required: A. Students are expected to produce a Financial Statements Analysis report about a Company of their choice. B. Are Financial Ratios Reliable Financial Indicator? A good analysis report usually consists of four sections: 1. Executive summary brief focus on important analysis results and conclusions. 2. Analysis overview background on the company, its industry, and its economic setting. 3. Evidential matter-financial statements and information used in the analysis, including ratios, comparisons, statistics, and graph. 4. Inferences forecasts, estimates, interpretations, and conclusions drawing on all sections of the report. In Millions of GBP 12 Months Ending Income Statement Revenue Cost Of Sales Gross Profit Company 1 P&G Ltd. - As Reported Distribution, Advertising And Selling Costs Administrative And Other Expenses Net Income Source: Bloomberg Interest Profit Before Taxation (EBIT) Taxation FY 2020 09/30/2020 FY 2021 09/30/2021 32,562.0 32,791.0 (10,420.0) (10,535.0) 6,180.0 6,027.0 (2,329.0 (2,118.0) (1,120.0) (608.0 2,166.0 671.0 1,495.0 (763.0) (331.0) 3,238.0 404.0 2,834.0 In Millions of GBP except Per Share 12 Months Ending Statement of Financial Position/ Balance Sheet Non-current Assets: Property, Plant And Equipment Office Furniture Equipment Investments Laptop Current Assets: Cash And Cash Equivalents Inventories Accounts Receivables Prepaid expenses Total Assets Current Liabilities: Short-term borrowings Accounts payable Other Loans Non Current Liabilities: Finance Lease Liabilities Borrowings (Long-Term) Bonds payable Total Liabilities P&G Ltd. - As Reported Stockholder Equity: Non-Controlling Interests Share Capital Retained Earnings Total Equity Source: Bloomberg FY 2020 09/30/2020 1,899.0 18,160.0 54 117.0 940.0 1,626.0 4,065.0 1,062.0 53.0 32,310.0 1,442.0 10,170.0 4,065.0 647.0 103.0 FY 2021 09/30/2021 2,364.0 5,518.0 1,715.0 16,674.0 32.0 88.0 1,046.0 1,287.0 3,834.0 35.0 68.0 29,090.0 235.0 340 10,210.0 8,715.0 4,065.0 3,834.0 26,792.0 23,150.0 1,107.0 9,106.0 3,834.0 588.0 103.0 788.0 5,940.0 Annual Data | Millions of US $ except per share data Revenue Cost Of Goods Sold Gross Profit Research And Development Expenses SG&A Expenses Other Operating Income Or Expenses Operating Expenses Operating Income Total Non-Operating Income/Expense Pre-Tax Income Income Taxes Income After Taxes Other Income Company 2 Income From Continuous Operations Income From Discontinued Operations Net Income EBITDA EBIT Labl Ll Labd امام Label Labd Lad امل Label Labl Labl EE EEE Nestle Ltd. Income Statement 2021-12-31 $95,700.93 $49,746.54 $45,954.39 $1,827.147 $27,585.54 $-3,763.704 $33,176.4 $12,777.99 $-955.149 $11,822.84 $2,473.76 $9,349.085 $18,814.14 $18,495.76 $19,401.67 $12.777.99 2020-12-31 $90,320.76 $45,832.87 $44,487.89 $1,680.962 $26,911.38 S-114.126 $28,706.47 $15,781.42 $-932.208 $14,849.21 $3,589.109 $11,260.1 $13,195.97 $13,046.65 $19,477.19 $15,781.42 Annual Data | Millions of US S except per share data Cash On Hand Receivables Inventory. Pre-Paid Expenses Other Current Assets Total Current Assets Property Plant And Equipment Long-Term Investments Goodwill And Intangible Assets Other Long-Term Assets Total Long-Term Assets Total Assets Total Current Liabilities Long Term Debt Other Non-Current Liabilities Total Long Term Liabilities Nestle Ltd. Statement of Financial Position Total Liabilities Common Stock Net Retained Earnings (Accumulated Deficit) Comprehensive Income Other Share Holders Equity Share Holder Equity. Total Liabilities And Share Holders Equity d chl اس Lahd Labd L.bl bl Ladd Labl chl bl Lbl EEE 2021-12-31 $15,311.93 $12,204.69 $13,109.51 $629.108 $1,621.456 $42,951.08 $31,012.26 $16,006.68 $58,244.41 $109,284.2 $152,235.3 $43,785.88 $39,914.96 $1,466.094 $49,666.67 $93,452.55 $308.536 $89,019.26 $-24,410.46 $58,782.71 $152,235.3 2020-12-31 $9,182.359 $11,461.68 $10,773.73 $508.768 $1,085.799 $36,336.93 $27,560.94 $15,571.29 $50,949.35 $95,951.34 $132,288.3 $42,367.48 $29,788 $2,250.526 $40,308.95 $82,676.43 $307.181 $81,927.68 $-26,411.15 $49,611.83 $132,288.3 Guide lines: Financial Statements Analysis must be carried out for the most required two financial year ends. Financial Statements Analysis report must satisfy a minimum of 1500- word count and presented in a word document file. Look up the company you are trying to analysis on any finance data base so you can get a detailed description and industry classification of the business. Financial Statements Analysis of A COMPANY The purpose of most financial statement analyses is to reduce uncertainty in business decisions through a rigorous and sound evaluation. A financial statement analysis report helps by directly addressing the building blocks of analysis and by identifying weaknesses in inference by requiring explanation: It forces us to organize our reasoning and to verify its flow and logic. A report helps us (re)evaluate evidence and refine conclusions on key building blocks. Required: A. Students are expected to produce a Financial Statements Analysis report about a Company of their choice. B. Are Financial Ratios Reliable Financial Indicator? A good analysis report usually consists of four sections: 1. Executive summary brief focus on important analysis results and conclusions. 2. Analysis overview-background on the company, its industry, and its economic setting. 3. Evidential matter financial statements and information used in the analysis, including ratios, comparisons, statistics, and graph. 4. Inferences forecasts, estimates, interpretations, and conclusions drawing on all sections of the report. In Millions of GBP 12 Months Ending Income Statement Revenue Cost Of Sales Gross Profit Company 1 P&G Ltd. - As Reported Distribution, Advertising And Selling Costs Administrative And Other Expenses Net Income Source: Bloomberg Interest Profit Before Taxation (EBIT) Taxation FY 2020 09/30/2020 FY 2021 09/30/2021 32,562.0 32,791.0 (10,420.0) (10,535.0) 6,180.0 6,027.0 (2,329.0 (2,118.0) (1,120.0) (608.0 2,166.0 671.0 1,495.0 (763.0) (331.0) 3,238.0 404.0 2,834.0 In Millions of GBP except Per Share 12 Months Ending Statement of Financial Position/ Balance Sheet Non-current Assets: Property, Plant And Equipment Office Furniture Equipment Investments Laptop Current Assets: Cash And Cash Equivalents Inventories Accounts Receivables Prepaid expenses Total Assets Current Liabilities: Short-term borrowings Accounts payable Other Loans Non Current Liabilities: Finance Lease Liabilities Borrowings (Long-Term) Bonds payable Total Liabilities P&G Ltd. - As Reported Stockholder Equity: Non-Controlling Interests Share Capital Retained Earnings Total Equity Source: Bloomberg FY 2020 09/30/2020 1,899.0 18,160.0 54 117.0 940.0 1,626.0 4,065.0 1,062.0 53.0 32,310.0 1,442.0 10,170.0 4,065.0 647.0 103.0 FY 2021 09/30/2021 2,364.0 5,518.0 1,715.0 16,674.0 32.0 88.0 1,046.0 1,287.0 3,834.0 35.0 68.0 29,090.0 235.0 340 10,210.0 8,715.0 4,065.0 3,834.0 26,792.0 23,150.0 1,107.0 9,106.0 3,834.0 588.0 103.0 788.0 5,940.0 Annual Data | Millions of US $ except per share data Revenue Cost Of Goods Sold Gross Profit Research And Development Expenses SG&A Expenses Other Operating Income Or Expenses Operating Expenses Operating Income Total Non-Operating Income/Expense Pre-Tax Income Income Taxes Income After Taxes Other Income Company 2 Income From Continuous Operations Income From Discontinued Operations Net Income EBITDA EBIT Labl Ll Labd امام Label Labd Lad امل Label Labl Labl EE EEE Nestle Ltd. Income Statement 2021-12-31 $95,700.93 $49,746.54 $45,954.39 $1,827.147 $27,585.54 $-3,763.704 $33,176.4 $12,777.99 $-955.149 $11,822.84 $2,473.76 $9,349.085 $18,814.14 $18,495.76 $19,401.67 $12.777.99 2020-12-31 $90,320.76 $45,832.87 $44,487.89 $1,680.962 $26,911.38 S-114.126 $28,706.47 $15,781.42 $-932.208 $14,849.21 $3,589.109 $11,260.1 $13,195.97 $13,046.65 $19,477.19 $15,781.42 Annual Data | Millions of US S except per share data Cash On Hand Receivables Inventory. Pre-Paid Expenses Other Current Assets Total Current Assets Property Plant And Equipment Long-Term Investments Goodwill And Intangible Assets Other Long-Term Assets Total Long-Term Assets Total Assets Total Current Liabilities Long Term Debt Other Non-Current Liabilities Total Long Term Liabilities Nestle Ltd. Statement of Financial Position Total Liabilities Common Stock Net Retained Earnings (Accumulated Deficit) Comprehensive Income Other Share Holders Equity Share Holder Equity. Total Liabilities And Share Holders Equity d chl اس Lahd Labd L.bl bl Ladd Labl chl bl Lbl EEE 2021-12-31 $15,311.93 $12,204.69 $13,109.51 $629.108 $1,621.456 $42,951.08 $31,012.26 $16,006.68 $58,244.41 $109,284.2 $152,235.3 $43,785.88 $39,914.96 $1,466.094 $49,666.67 $93,452.55 $308.536 $89,019.26 $-24,410.46 $58,782.71 $152,235.3 2020-12-31 $9,182.359 $11,461.68 $10,773.73 $508.768 $1,085.799 $36,336.93 $27,560.94 $15,571.29 $50,949.35 $95,951.34 $132,288.3 $42,367.48 $29,788 $2,250.526 $40,308.95 $82,676.43 $307.181 $81,927.68 $-26,411.15 $49,611.83 $132,288.3 Guide lines: Financial Statements Analysis must be carried out for the most required two financial year ends. Financial Statements Analysis report must satisfy a minimum of 1500- word count and presented in a word document file. Look up the company you are trying to analysis on any finance data base so you can get a detailed description and industry classification of the business.
Expert Answer:
Answer rating: 100% (QA)
Financial Statements Analysis of Nestle Ltd Introduction Nestle Ltd is a Swiss multinational food and drink processing conglomerate corporation headquartered in Vevey Vaud Switzerland It is the worlds ... View the full answer

Related Book For 
Posted Date:
Students also viewed these accounting questions
-
Write a report on strategic analysis of a company on SYSCO including tables, figures and appendices. - Briefly describe the company, its products or services -brief history? major events, founders or...
-
Requires you to conduct a strategic analysis of a company of your choice. You are required to recommend strategic options for that company with justifications after assessing both its external and...
-
What problems are expected in an analysis of a company using the LIFO inventory method when costs are increasing? What effects do price changes have on the (a) Inventory turnover ratio (b) Current...
-
A ball is thrown from the roof of a 1 0 0 m high building at a speed of 1 0 m / s making 3 0 angles with the horizontal. A child waiting on the ground at the door of the building falls into a coma...
-
How is the access control list approach different from RBAC?
-
A star hockey player has negotiated a contract that pays him $5 million in the first year, $7 million in the second year, and $8 million in the third year. If his personal borrowing rate of interest...
-
Using the wine quality data from Table B.11, fit a model relating wine quality $y$ to flavor $x_{4}$ using region as an allocated code, taking on the values shown in the table $(1,2,3)$. Discuss the...
-
The following data pertain to the Aquarius Hotel Supply Company for the year just ended. Budgeted sales revenue.................................................................$945,000 Budgeted...
-
You are driving your car along a country road at a speed of 26.0 m/s. As you come over the crest of a hill, you notice a farm tractor 25 m ahead of you on the road, moving in the same direction as...
-
A Y-connected load, with Z A = 10 0 , Z B = 10 60, and Z C = 10 60 , is connected to a three-phase, three-wire, ABC system having effective line voltage 141.4 V. Find the load voltages V AO , V BO...
-
On January 1, 2024, Jaewoo Industries had outstanding 800,000 common shares ($1 par) that originally sold for $20 per share, and 3,000 shares of 10% cumulative preferred stock ($100 par), convertible...
-
Which of the following is not a common type of governmental fund expenditure? a. Capital outlay. b. Debt service. c. Salaries and wages. d. Depreciation.
-
Allotments are best defined as a. legislative appropriations subdivided into more detailed expenditure categories by the executive branch. b. legislative appropriations subdivided by time periods. c....
-
In the year that any advance refunding occurs, which of the following disclosures is not required by GAAP? a. Difference in debt service requirements of the old defeased issue and new issue, adjusted...
-
An appropriation that has expired a. is reported by a federal agency as unapportioned authority. b. is reported by a federal agency as unexpended appropriations. c. is reported by a federal agency as...
-
Which of the following events would not potentially result in a gain that would be reported in a government hospitals financial statements? a. Third-party reimbursements that exceed initial...
-
The Federal Reserve can be a short-term source of funds. Discuss how a bank borrows from the Fed and why a bank would borrow from the Fed. Also discuss how the borrowing interest rate is established...
-
Cornell and Roberts are partners who agree to admit Stanley to their partnership. Cornell has a capital balance of $80,000 and Roberts has a capital balance of $120,000. Cornell and Roberts share net...
-
Cricket Corporation's financial statements for 2009 showed the following: Notice in these data that the company had a debt of only $40,000 compared with common stock outstanding of $230,000. A...
-
Revenues are normally recognized when the delivery of goods or services has occurred, there is persuasive evidence of an arrangement for customer payment, the price is fixed or determinable, and...
-
As described in a recent annual report, Polaroid Corporation designs, manufactures, and markets worldwide a variety of products primarily in instant image-recording fields, including instant...
-
At what height above the surface of Pluto is the acceleration due to gravity half its surface value?
-
How far above Farth's surface must a \(10,000-\mathrm{kg}\) boulder be moved to increase the mass of the Earthboulder system by \(2.50 \mathrm{mg}\) ? Assume the same ratio of energy change to mass...
-
Show that for small displacements the restoring force exerted on part 2 of the displaced string in Figure 15.14 is linearly proportional to the displacement of that part from its equilibrium...

Study smarter with the SolutionInn App