

Question: Using the wine quality data from Table B.11, fit a model relating wine quality $y$ to flavor $x_{4}$ using region as an allocated code, taking
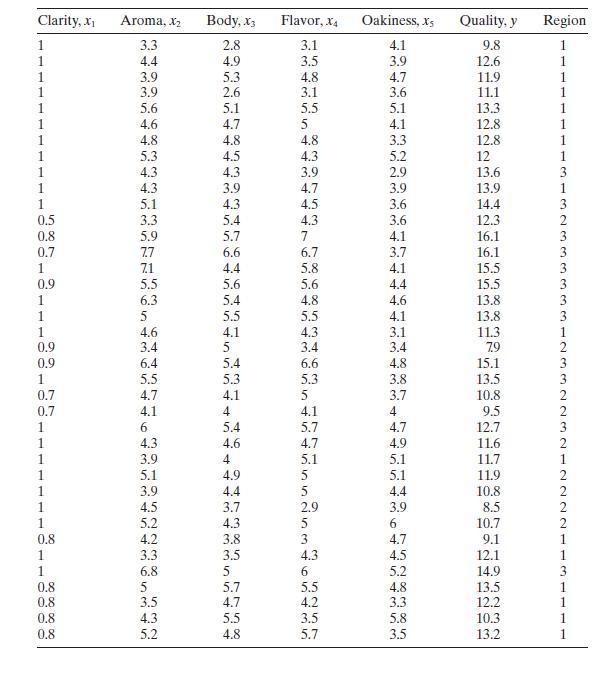
Using the wine quality data from Table B.11, fit a model relating wine quality $y$ to flavor $x_{4}$ using region as an allocated code, taking on the values shown in the table $(1,2,3)$. Discuss the interpretation of the parameters in this model. Compare the model to the one you built using indicator variables in Problem 8.13.
Data From Problem 8.13
Table B. 11 presents data on the quality of Pinot Noir wine.
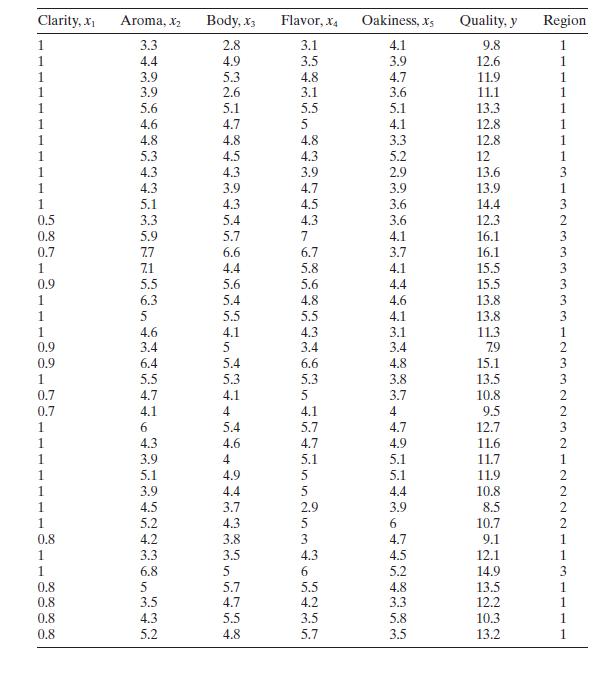
Clarity, X Aroma, X2 Body, x3 Flavor, X4 Oakiness, Xs Quality, y Region 3.3 2.8 4.4 4.9 3.9 5.3 3.9 2.6 5.6 5.1 4.6 4.7 4.8 4.8 4.8 5.3 4.5 4.3 4.3 3.9 4.3 3.9 4.7 5.1 4.3 4.5 1 99-86---8-289 0.5 3.3 5.4 4.3 ECECEECECE 3.1 4.1 9.8 1 3.5 3.9 12.6 1 4.8 4.7 11.9 3.1 3.6 11.1 5.5 5.1 13.3 4.1 12.8 3.3 12.8 1 4.3 5.2 12 1 2.9 13.6 3 3.9 13.9 1 3.6 14.4 3.6 12.3 0.8 5.9 5.7 4.1 16.1 0.7 7.7 6.6 6.7 3.7 16.1 7.1 4.4 5.8 4.1 15.5 0.9 5.5 5.6 5.6 4.4 15.5 6.3 5.4 4.8 4.6 13.8 3 5.5 5.5 4.1 13.8 3 4.6 4.1 4.3 3.1 11.3 1 0.9 3.4 5 3.4 3.4 7.9 2 0.9 6.4 5.4 6.6 4.8 15.1 3 5.5 5.3 5.3 3.8 13.5 0.7 4.7 4.1 5 3.7 10.8 0.7 4.1 4 4.1 4 9.5 6 5.4 4.3 4.6 46 5.7 4.7 12.7 4.7 4.9 11.6 3.9 4 5.1 5.1 11.7 5.1 4.9 3.9 4.4 4.5 3.7 5.2 4.3 0.8 4.2 3.8 9473804 5 5.1 11.9 5 4.4 10.8 2.9 3.9 8.5 6 10.7 3223212222 3 4.7 9.1 1 1 3.3 3.5 4.3 4.5 12.1 1 1 0.8 0.8 0.8 0.8 65372 6.8 5 6 5.7 3.5 4.7 4.2 4.3 5.5 3.5 5.2 4.8 5.7 5257 5.2 14.9 3 5.5 4.8 13.5 1 3.3 12.2 1 5.8 10.3 1 3.5 13.2 1
Step by Step Solution
3.41 Rating (151 Votes )
There are 3 Steps involved in it

Get step-by-step solutions from verified subject matter experts