

Find five years of monthly returns for two mutual funds, Vanguard's U.S. Growth Fund and U.S....
Fantastic news! We've Found the answer you've been seeking!
Question:
Transcribed Image Text:
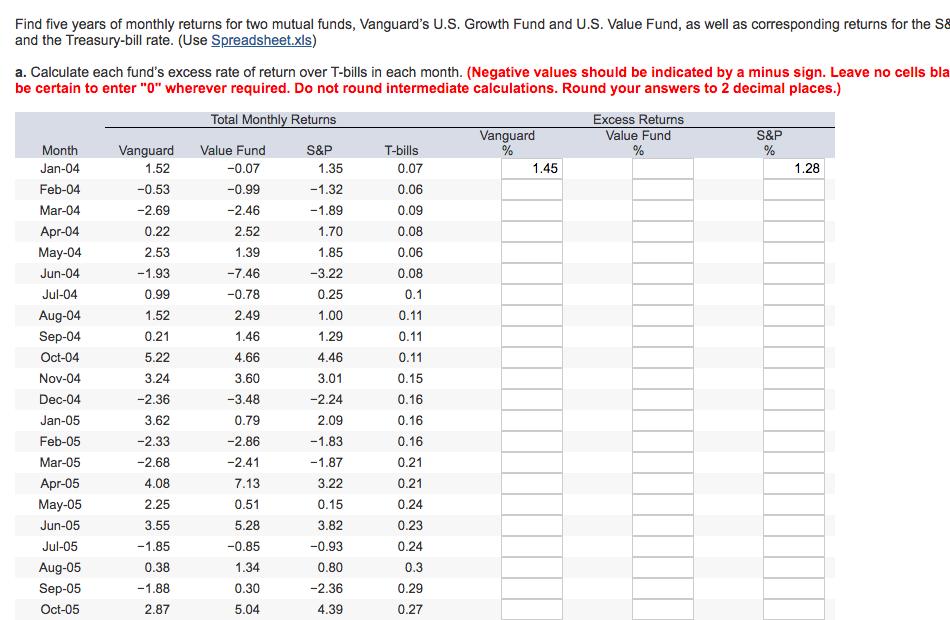
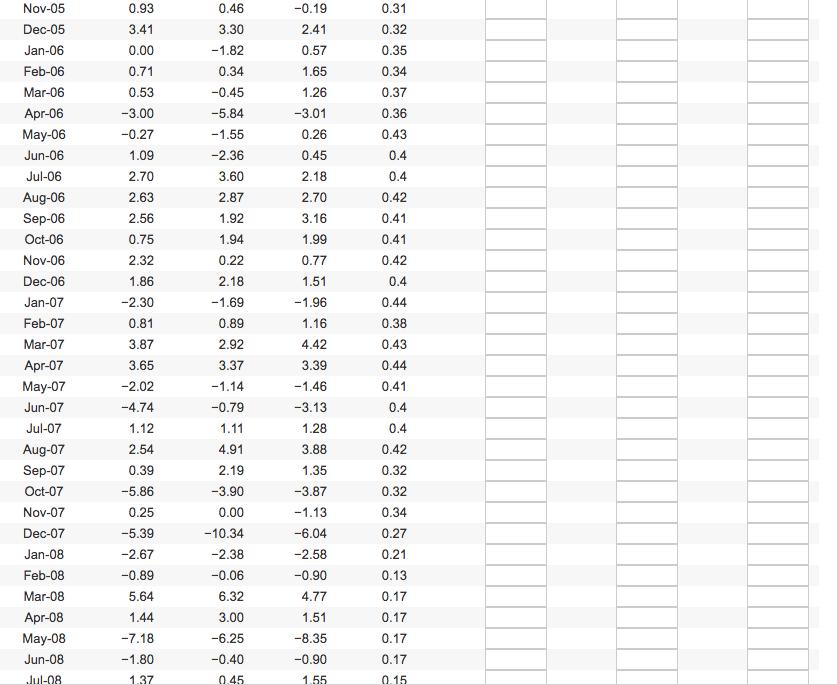
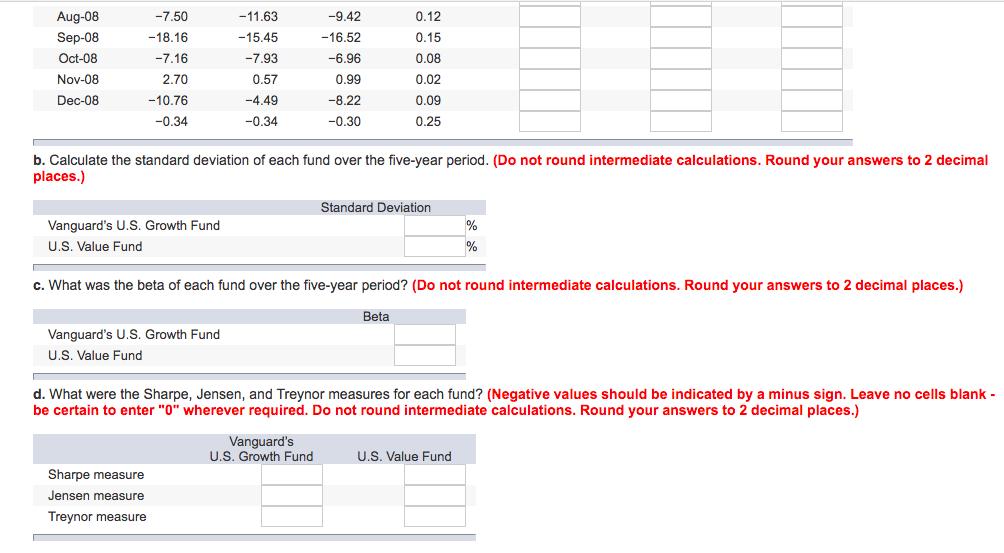
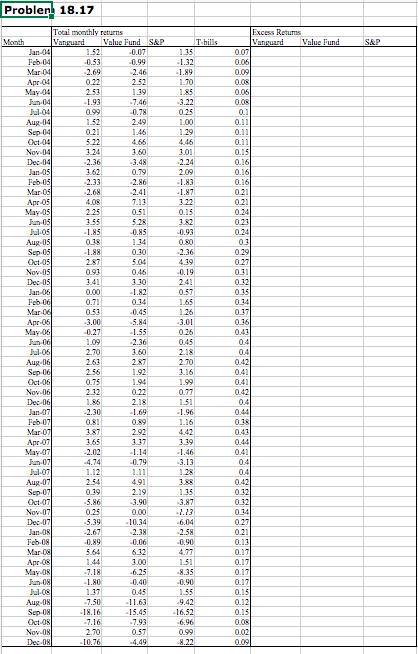
Find five years of monthly returns for two mutual funds, Vanguard's U.S. Growth Fund and U.S. Value Fund, as well as corresponding returns for the S& and the Treasury-bill rate. (Use Spreadsheet.xls) a. Calculate each fund's excess rate of return over T-bills in each month. (Negative values should be indicated by a minus sign. Leave no cells bla be certain to enter "0" wherever required. Do not round intermediate calculations. Round your answers to 2 decimal places.) Total Monthly Returns Excess Returns Vanguard % Value Fund % S&P % Value Fund S&P T-bills Month Jan-04 Vanguard 1.52 -0.07 1.28 Feb-04 -0.53 -0.99 Mar-04 -2.69 -2.46 Apr-04 0.22 2.52 May-04 2.53 1.39 Jun-04 -1.93 -7.46 Jul-04 0.99 -0.78 Aug-04 1.52 2.49 Sep-04 0.21 1.46 Oct-04 5.22 4.66 Nov-04 3.24 3.60 Dec-04 -2.36 -3.48 Jan-05 3.62 0.79 Feb-05 -2.33 -2.86 Mar-05 -2.68 -2.41 Apr-05 4.08 7.13 May-05 2.25 0.51 Jun-05 3.55 5.28 Jul-05 -1.85 -0.85 Aug-05 0.38 1.34 Sep-05 -1.88 0.30 Oct-05 2.87 5.04 1.35 -1.32 -1.89 1.70 1.85 -3.22 0.25 1.00 1.29 4.46 3.01 -2.24 2.09 -1.83 -1.87 3.22 0.15 3.82 -0.93 0.80 -2.36 4.39 0.07 0.06 0.09 0.08 0.06 0.08 0.1 0.11 0.11 0.11 0.15 0.16 0.16 0.16 0.21 0.21 0.24 0.23 0.24 0.3 0.29 0.27 1.45 Nov-05 Dec-05 Jan-06 Feb-06 Mar-06 Apr-06 May-06 Jun-06 Jul-06 Aug-06 Sep-06 Oct-06 Nov-06 Dec-06 Jan-07 Feb-07 Mar-07 Apr-07 May-07 Jun-07 Jul-07 Aug-07 Sep-07 Oct-07 Nov-07 Dec-07 Jan-08 Feb-08 Mar-08 Apr-08 May-08 Jun-08 Jul-08 0.93 3.41 0.00 0.71 0.53 -3.00 -0.27 1.09 2.70 2.63 2.56 0.75 2.32 1.86 -2.30 0.81 3.87 3.65 -2.02 -4.74 1.12 2.54 0.39 -5.86 0.25 -5.39 -2.67 -0.89 5.64 1.44 -7.18 -1.80 1.37 0.46 3.30 -1.82 0.34 -0.45 -5.84 -1.55 -2.36 3.60 2.87 1.92 1.94 0.22 2.18 -1.69 0.89 2.92 3.37 -1.14 -0.79 1.11 4.91 2.19 -3.90 0.00 -10.34 -2.38 -0.06 6.32 3.00 -6.25 -0.40 0.45 -0.19 2.41 0.57 1.65 1.26 -3.01 0.26 0.45 2.18 2.70 3.16 1.99 0.77 1.51 -1.96 1.16 4.42 3.39 -1.46 -3.13 1.28 3.88 1.35 -3.87 -1.13 -6.04 -2.58 -0.90 4.77 1.51 -8.35 -0.90 1.55 0.31 0.32 0.35 0.34 0.37 0.36 0.43 0.4 0.4 0.42 0.41 0.41 0.42 0.4 0.44 0.38 0.43 0.44 0.41 0.4 0.4 0.42 0.32 0.32 0.34 0.27 0.21 0.13 0.17 0.17 0.17 0.17 0.15 Aug-08 -7.50 -11.63 -9.42 0.12 Sep-08 -18.16 -15.45 -16.52 0.15 Oct-08 -7.16 -7.93 -6.96 0.08 Nov-08 2.70 0.57 0.99 0.02 Dec-08 -10.76 -4.49 -8.22 0.09 -0.34 -0.34 -0.30 0.25 b. Calculate the standard deviation of each fund over the five-year period. (Do not round intermediate calculations. Round your answers to 2 decimal places.) Standard Deviation Vanguard's U.S. Growth Fund % % U.S. Value Fund c. What was the beta of each fund over the five-year period? (Do not round intermediate calculations. Round your answers to 2 decimal places.) Beta Vanguard's U.S. Growth Fund U.S. Value Fund d. What were the Sharpe, Jensen, and Treynor measures for each fund? (Negative values should be indicated by a minus sign. Leave no cells blank - be certain to enter "0" wherever required. Do not round intermediate calculations. Round your answers to 2 decimal places.) Vanguard's U.S. Growth Fund U.S. Value Fund Sharpe measure Jensen measure Treynor measure Problen! 18.17 Month Jan-04 Feb 04 Mar 04 Apr 04 May 04 Jun-04 Jul-04 Aug-04 Sep 04 Oct-04 Nov 04 Dec 04 Jan-05 Feb 05 Mar 05 Apr 05 May 05 Jun-05 Jul-05 Aug-05 Sep-05 Oct-05 Nov 05 Dec 05 Jan-06 Feb 06 Mar 06 Apr 06 May 06 Jun-06 Jul-06 Aug-06 Sep 06 Oct-06 Nov 06 Dec 06 Jan-07 Feb 07 Mar 07 Apr 07 May 07 Jun-07 Jul-07 Aug-07 Sep-07 Oct-07 Nov 07 Dec 07 Jan-08 Feb 08 Mar-08 Apr 08 May-08 Jun-08 Jul-08 Aug-08 Sep-08 Oct-08 Nov 08 Dec 08 Total monthly returns Vanguard 1.52 -0.53 -2.69 0.22 2.53 -1.93 0.99 1.52 0.21 5.22 3.24 -2.36 3.62 -2.33 -2.68 4.08 2.25 3.55 -1.85 0.38 -1.88 2.87 0.93 3.41 0.00 0.71 0.53 -3.00 -0.27 1.09 2.70 2.63 2.56 0.75 1.86 -2.30 0.81 3.87 3.65 -2.02 -4.74 1.12 2.54 0.39 -5.86 0.25 5.39 -2.67 -0.89 5.64 1.44 -1.80 1.37 -7.50 -18.16 -7.16 2.70 -10.76 Value Fund S&P -0.07 -0.99 -2.46 2.52 1.39 -7.46 -0.78 2.49 1.46 4.66 3.60 -3.48 0.79 -2.86 -2.41 7.13 0.51 5.28 -0.85 1.34 0.30 5.04 0.46 3.30 -1.82 0.34 -0.45 -5.84 -1.55 -2.36 3.60 2.87 1.92 1.94 0.22 2,18 -1.69 0.89 2.92 3.37 -0.79 1.11 4.91 2.19 -3.90 0.00 -10.34 -2.38 -0.06 6.32 3.00 -6.25 -0.40 0.45 -11.63 -15.45 -7.93 0.57 -4.49 1.35 -1.32 -1.89 1.70 1.85 -3.22 0.25 1.00 1.29 4.46 3.01 2.24 2.09 -1.83 -1.87 0.15 3.82 -0.93 0.80 -2.36 4.39 -0.19 2.41 0.57 1.65 1.26 -3.01 0.26 0.45 2.18 2.70 3.16 1.99 0.77 1.51 -1.96 1.16 4.42 3.39 -1.46 -3.13 1.28 3.88 1.35 -3.87 -1.13 -6.04 -2.58 -0.90 4.77 1.51 -8.35 -0.90 1.55 -9.42 -16.52 -6.96 0.99 8.22 T-bills Excess Returns Vanguard Value Fund 0.07 0.06 0.09 0.08 0.06 0.08 0.1 0.11 0.11 0.11 0.15 0.16 0.16 0.16 021 0.21 0.24 0.23 0.24 0.3 0.29 0.27 0.31 0.32 0.35 0.34 0.37 0.36 0.43 0.4 04 0.42 0.41 0.41 0.42 0.4 0.44 0.38 0.43 0.44 041 0.4 0.4 0.42 0.32 0.32 034 0.27 0.21 0.13 0.17 0.17 0.17 0.17 0.15 0.12 0.15 0.08 0.02 0.09 S&P Find five years of monthly returns for two mutual funds, Vanguard's U.S. Growth Fund and U.S. Value Fund, as well as corresponding returns for the S& and the Treasury-bill rate. (Use Spreadsheet.xls) a. Calculate each fund's excess rate of return over T-bills in each month. (Negative values should be indicated by a minus sign. Leave no cells bla be certain to enter "0" wherever required. Do not round intermediate calculations. Round your answers to 2 decimal places.) Total Monthly Returns Excess Returns Vanguard % Value Fund % S&P % Value Fund S&P T-bills Month Jan-04 Vanguard 1.52 -0.07 1.28 Feb-04 -0.53 -0.99 Mar-04 -2.69 -2.46 Apr-04 0.22 2.52 May-04 2.53 1.39 Jun-04 -1.93 -7.46 Jul-04 0.99 -0.78 Aug-04 1.52 2.49 Sep-04 0.21 1.46 Oct-04 5.22 4.66 Nov-04 3.24 3.60 Dec-04 -2.36 -3.48 Jan-05 3.62 0.79 Feb-05 -2.33 -2.86 Mar-05 -2.68 -2.41 Apr-05 4.08 7.13 May-05 2.25 0.51 Jun-05 3.55 5.28 Jul-05 -1.85 -0.85 Aug-05 0.38 1.34 Sep-05 -1.88 0.30 Oct-05 2.87 5.04 1.35 -1.32 -1.89 1.70 1.85 -3.22 0.25 1.00 1.29 4.46 3.01 -2.24 2.09 -1.83 -1.87 3.22 0.15 3.82 -0.93 0.80 -2.36 4.39 0.07 0.06 0.09 0.08 0.06 0.08 0.1 0.11 0.11 0.11 0.15 0.16 0.16 0.16 0.21 0.21 0.24 0.23 0.24 0.3 0.29 0.27 1.45 Nov-05 Dec-05 Jan-06 Feb-06 Mar-06 Apr-06 May-06 Jun-06 Jul-06 Aug-06 Sep-06 Oct-06 Nov-06 Dec-06 Jan-07 Feb-07 Mar-07 Apr-07 May-07 Jun-07 Jul-07 Aug-07 Sep-07 Oct-07 Nov-07 Dec-07 Jan-08 Feb-08 Mar-08 Apr-08 May-08 Jun-08 Jul-08 0.93 3.41 0.00 0.71 0.53 -3.00 -0.27 1.09 2.70 2.63 2.56 0.75 2.32 1.86 -2.30 0.81 3.87 3.65 -2.02 -4.74 1.12 2.54 0.39 -5.86 0.25 -5.39 -2.67 -0.89 5.64 1.44 -7.18 -1.80 1.37 0.46 3.30 -1.82 0.34 -0.45 -5.84 -1.55 -2.36 3.60 2.87 1.92 1.94 0.22 2.18 -1.69 0.89 2.92 3.37 -1.14 -0.79 1.11 4.91 2.19 -3.90 0.00 -10.34 -2.38 -0.06 6.32 3.00 -6.25 -0.40 0.45 -0.19 2.41 0.57 1.65 1.26 -3.01 0.26 0.45 2.18 2.70 3.16 1.99 0.77 1.51 -1.96 1.16 4.42 3.39 -1.46 -3.13 1.28 3.88 1.35 -3.87 -1.13 -6.04 -2.58 -0.90 4.77 1.51 -8.35 -0.90 1.55 0.31 0.32 0.35 0.34 0.37 0.36 0.43 0.4 0.4 0.42 0.41 0.41 0.42 0.4 0.44 0.38 0.43 0.44 0.41 0.4 0.4 0.42 0.32 0.32 0.34 0.27 0.21 0.13 0.17 0.17 0.17 0.17 0.15 Aug-08 -7.50 -11.63 -9.42 0.12 Sep-08 -18.16 -15.45 -16.52 0.15 Oct-08 -7.16 -7.93 -6.96 0.08 Nov-08 2.70 0.57 0.99 0.02 Dec-08 -10.76 -4.49 -8.22 0.09 -0.34 -0.34 -0.30 0.25 b. Calculate the standard deviation of each fund over the five-year period. (Do not round intermediate calculations. Round your answers to 2 decimal places.) Standard Deviation Vanguard's U.S. Growth Fund % % U.S. Value Fund c. What was the beta of each fund over the five-year period? (Do not round intermediate calculations. Round your answers to 2 decimal places.) Beta Vanguard's U.S. Growth Fund U.S. Value Fund d. What were the Sharpe, Jensen, and Treynor measures for each fund? (Negative values should be indicated by a minus sign. Leave no cells blank - be certain to enter "0" wherever required. Do not round intermediate calculations. Round your answers to 2 decimal places.) Vanguard's U.S. Growth Fund U.S. Value Fund Sharpe measure Jensen measure Treynor measure Problen! 18.17 Month Jan-04 Feb 04 Mar 04 Apr 04 May 04 Jun-04 Jul-04 Aug-04 Sep 04 Oct-04 Nov 04 Dec 04 Jan-05 Feb 05 Mar 05 Apr 05 May 05 Jun-05 Jul-05 Aug-05 Sep-05 Oct-05 Nov 05 Dec 05 Jan-06 Feb 06 Mar 06 Apr 06 May 06 Jun-06 Jul-06 Aug-06 Sep 06 Oct-06 Nov 06 Dec 06 Jan-07 Feb 07 Mar 07 Apr 07 May 07 Jun-07 Jul-07 Aug-07 Sep-07 Oct-07 Nov 07 Dec 07 Jan-08 Feb 08 Mar-08 Apr 08 May-08 Jun-08 Jul-08 Aug-08 Sep-08 Oct-08 Nov 08 Dec 08 Total monthly returns Vanguard 1.52 -0.53 -2.69 0.22 2.53 -1.93 0.99 1.52 0.21 5.22 3.24 -2.36 3.62 -2.33 -2.68 4.08 2.25 3.55 -1.85 0.38 -1.88 2.87 0.93 3.41 0.00 0.71 0.53 -3.00 -0.27 1.09 2.70 2.63 2.56 0.75 1.86 -2.30 0.81 3.87 3.65 -2.02 -4.74 1.12 2.54 0.39 -5.86 0.25 5.39 -2.67 -0.89 5.64 1.44 -1.80 1.37 -7.50 -18.16 -7.16 2.70 -10.76 Value Fund S&P -0.07 -0.99 -2.46 2.52 1.39 -7.46 -0.78 2.49 1.46 4.66 3.60 -3.48 0.79 -2.86 -2.41 7.13 0.51 5.28 -0.85 1.34 0.30 5.04 0.46 3.30 -1.82 0.34 -0.45 -5.84 -1.55 -2.36 3.60 2.87 1.92 1.94 0.22 2,18 -1.69 0.89 2.92 3.37 -0.79 1.11 4.91 2.19 -3.90 0.00 -10.34 -2.38 -0.06 6.32 3.00 -6.25 -0.40 0.45 -11.63 -15.45 -7.93 0.57 -4.49 1.35 -1.32 -1.89 1.70 1.85 -3.22 0.25 1.00 1.29 4.46 3.01 2.24 2.09 -1.83 -1.87 0.15 3.82 -0.93 0.80 -2.36 4.39 -0.19 2.41 0.57 1.65 1.26 -3.01 0.26 0.45 2.18 2.70 3.16 1.99 0.77 1.51 -1.96 1.16 4.42 3.39 -1.46 -3.13 1.28 3.88 1.35 -3.87 -1.13 -6.04 -2.58 -0.90 4.77 1.51 -8.35 -0.90 1.55 -9.42 -16.52 -6.96 0.99 8.22 T-bills Excess Returns Vanguard Value Fund 0.07 0.06 0.09 0.08 0.06 0.08 0.1 0.11 0.11 0.11 0.15 0.16 0.16 0.16 021 0.21 0.24 0.23 0.24 0.3 0.29 0.27 0.31 0.32 0.35 0.34 0.37 0.36 0.43 0.4 04 0.42 0.41 0.41 0.42 0.4 0.44 0.38 0.43 0.44 041 0.4 0.4 0.42 0.32 0.32 034 0.27 0.21 0.13 0.17 0.17 0.17 0.17 0.15 0.12 0.15 0.08 0.02 0.09 S&P
Expert Answer:
Answer rating: 100% (QA)
b c d a Calculate the excess return of each fund over Tbills in each ... View the full answer

Related Book For 
Posted Date:
Students also viewed these mathematics questions
-
Log in to Connect and link to the material for Chapter 18, where you will find five years of monthly returns for two mutual funds, Vanguard's U.S. Growth Fund and U.S. Value Fund, as well as...
-
Use the cash flows and competitive spreads shown in the table below. ($ millions) Year 0 Year 1 Year 2 Years 3-10 Investment 140 Production (millions of pounds per year) Spread ($ per pound) 44 84...
-
Below are percentages for annual sales growth and net sales attributed to loyaity card usage at 74 Noodles & Company restaurants. Annual Sales Growth (%) and Loyalty Card Usage (% of Net Sales) (n =...
-
The degrees of operating leverage for Delta Corp. and Epsilon Co. are 1.95 and 5.15, respectively. Both have operating incomes of $56,600. Determine their respective contribution margins....
-
Orient Express is a global distribution company that transports its clients products to customers in Hong Kong, Singapore, and Taipei. All the products Orient Express ships are stored at three...
-
To find equilibrium conditions, a. the first vector of state probabilities must be known. b. the matrix of transition probabilities is unnecessary. c. the general terms in the vector of state...
-
How might an auditor perform a transaction walk-through when considering controls over personnel and payroll?
-
At the beginning of last year, Diekow Productions, set direct labor standards of 20 hours at $15 per hour for each product produced. During the year, 20,500 direct labor hours were actually worked at...
-
The Regal Cycle Company manufactures three types of bicycles-a dirt bike, a mountain bike, and a racing bike. Data on sales and expenses for the past quarter follow: Sales Variable manufacturing and...
-
Problem 2: A single-piece bicycle crank is shown below under the following loading scenario: the rider is pedaling forward by applying a vertical force Fp = 500 N on the left pedal and no force on...
-
what ways do prevailing ideologies shape societal norms and values, and how do these constructs evolve over time?
-
For solutions of optimization problems from Examples 3.3 analyse sensitivity of. 1. the demand for a production factor and the maximum profit to changes in a product price and to changes in values of...
-
What are a demand function and an inverse function of demand for one product?
-
Is it possible in the simple model of exchange or in the static Arrow-Hurwicz model that an allocation not accepted by traders is Pareto optimal?
-
What conditions need to be satisfied by exogenous linear: demand function and function of product supply to have a positive equilibrium price established on a market of this product?
-
In periods price of the first good and the price of the second good change according to equations: t = 0, 1, 2, ..., 20 a utility level a consumer wants to achieve, the
-
Here is yield curve for 1 to 5-year maturity bonds. Based on this curve what is expected/forward interest rate on 1-year bond, 2 years from now? Bond Years to Maturity A B C D E 1 2 12345 3 4 Yield...
-
When the concentration of a strong acid is not substantially higher than 1.0 10-7 M, the ionization of water must be taken into account in the calculation of the solution's pH. (a) Derive an...
-
Based on the Teledyne data answer the following: a. Calculate the intrinsic value of the April 140 and the October 170 calls. b. Calculate the intrinsic value of the April 140 and the October 170...
-
Given the information in Problem 201, assume that the investor holds until the contract expires. Ignore the four days after purchase and assume that on the next to last day of trading in March the...
-
What is the "typical" business cycle stock price relationship?
-
Describe circumstances that might cause a client to understate assets such as cash and financial investments.
-
What prevents the person who opens incoming mail from being able to abstract cash collections from customers?
-
Select the best answer for each of the following situations and give reasons for your choice. a. You have been assigned to the year-end audit of a financial institution and are planning the timing of...

Study smarter with the SolutionInn App