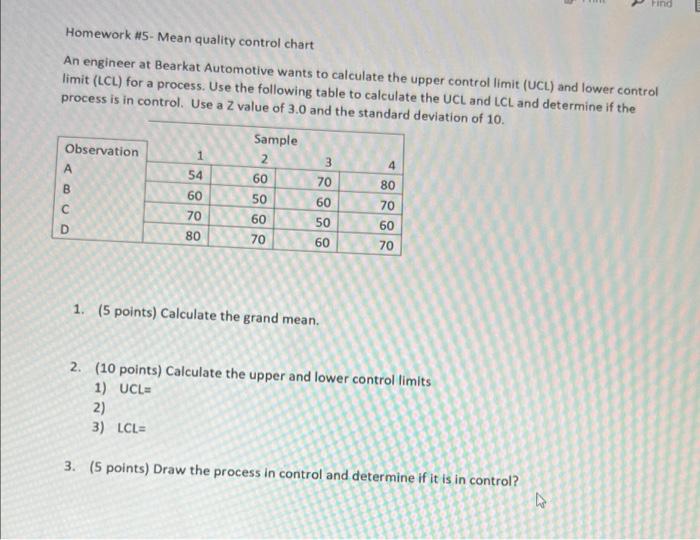
Question: Find Homework #5- Mean quality control chart An engineer at Bearkat Automotive wants to calculate the upper controllimit (UCL) and lower control limit (LCL) for

Find Homework #5- Mean quality control chart An
Find Homework #5- Mean quality control chart An engineer at Bearkat Automotive wants to calculate the upper controllimit (UCL) and lower control limit (LCL) for a process. Use the following table to calculate the UCL and LCL and determine if the process is in control. Use a Z value of 3.0 and the standard deviation of 10 Observation A 1 w 4 54 B Sample 2 60 50 60 70 80 60 3 70 60 50 60 D 70 80 70 60 70 1. (5 points) Calculate the grand mean. 2. (10 points) Calculate the upper and lower control limits 1) UCL 2) 3) LCLE 3. (5 points) Draw the process in control and determine if it is in control? w

Step by Step Solution

There are 3 Steps involved in it

1 Expert Approved Answer
Step: 1 Unlock blur-text-image
Question Has Been Solved by an Expert!

Get step-by-step solutions from verified subject matter experts

Step: 2 Unlock
Step: 3 Unlock

Students Have Also Explored These Related General Management Questions!