

Question: Find out what each ratio's definition is , understand it and type in what is a good ratio and what is a bad ratio; For
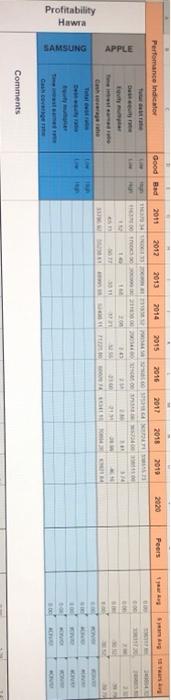
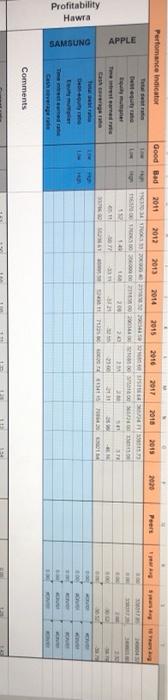
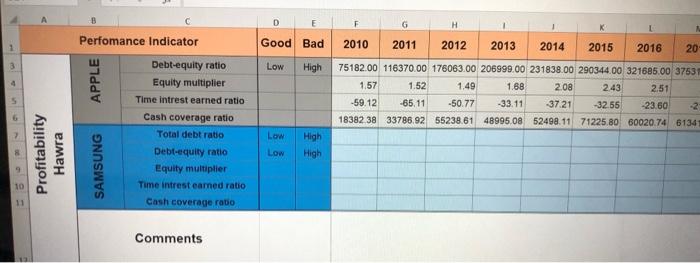
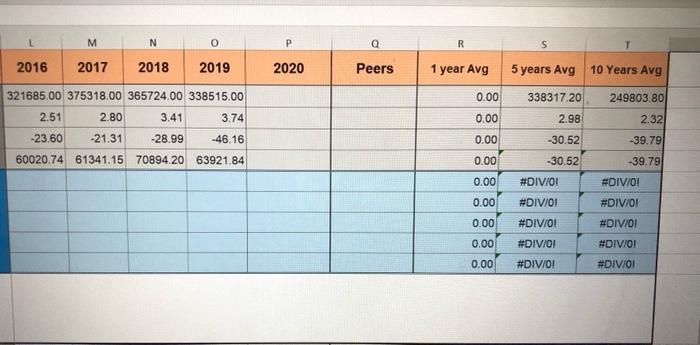
Perfomance Indicator Good Bad 2011 2012 2013 2014 2015 2010 2017 2015 2013 2000 Peers ter perst res APPLE SE NA PO LET WHERE . ME Tree agen 200 BIH HOTEN Profitability Hawra SAMSUNG Comments D E F Perfomance Indicator Good Bad 2010 2011 2012 2013 2014 2015 2016 20 3 Low High 4 APPLE 75182.00 116370.00 176063.00 206999.00 231838.00 290344.00 321685.00 3753 1.57 1.52 1.49 1.68 208 243 2.51 -59.12 -65.11 -50.77 -33.11 37.21 -32.55 -23.60 -2 18382 38 33786.92 55238.61 48995.08 52498.11 71225.80 60020.74 6134 Profitability Hawra Debt-equity ratio Equity multiplier Time intrest earned ratio Cash coverage ratio Total debt ratio Debt-equity ratio Equity multiplier Time intrest earned ratio Cash coverage rabo Low LOW High High SAMSUNG 10 11 Comments M N P Q R 2016 2017 2018 2019 2020 Peers 1 year Avg 5 years Avg 10 Years Avg 0.00 338317.20 249803.80 321685.00 375318.00 365724.00 338515.00 2.51 2.80 3.41 3.74 0.00 2.32 0.00 2.98 -30.52 -30,52 -23.60 -21.31 -28.99 -46.16 60020.74 61341.15 70894.20 63921.84 -39.79 0.00 -39.79 0.00 #DIV/0! #DIV/0! 0.00 #DIV/0! #DIV/01 0.00 #DIV/OI #DIV/OI #DIV/0! #DIV/0! 0.00 0.00 #DIV/0! #DIV/01 Perfomance Indicator Good Bad 2011 2012 2013 2014 2015 2010 2017 2015 2013 2000 Peers ter perst res APPLE SE NA PO LET WHERE . ME Tree agen 200 BIH HOTEN Profitability Hawra SAMSUNG Comments D E F Perfomance Indicator Good Bad 2010 2011 2012 2013 2014 2015 2016 20 3 Low High 4 APPLE 75182.00 116370.00 176063.00 206999.00 231838.00 290344.00 321685.00 3753 1.57 1.52 1.49 1.68 208 243 2.51 -59.12 -65.11 -50.77 -33.11 37.21 -32.55 -23.60 -2 18382 38 33786.92 55238.61 48995.08 52498.11 71225.80 60020.74 6134 Profitability Hawra Debt-equity ratio Equity multiplier Time intrest earned ratio Cash coverage ratio Total debt ratio Debt-equity ratio Equity multiplier Time intrest earned ratio Cash coverage rabo Low LOW High High SAMSUNG 10 11 Comments M N P Q R 2016 2017 2018 2019 2020 Peers 1 year Avg 5 years Avg 10 Years Avg 0.00 338317.20 249803.80 321685.00 375318.00 365724.00 338515.00 2.51 2.80 3.41 3.74 0.00 2.32 0.00 2.98 -30.52 -30,52 -23.60 -21.31 -28.99 -46.16 60020.74 61341.15 70894.20 63921.84 -39.79 0.00 -39.79 0.00 #DIV/0! #DIV/0! 0.00 #DIV/0! #DIV/01 0.00 #DIV/OI #DIV/OI #DIV/0! #DIV/0! 0.00 0.00 #DIV/0! #DIV/01
Step by Step Solution
There are 3 Steps involved in it

Get step-by-step solutions from verified subject matter experts