

Question: Find the answer 1 CH3 Graded Activity 10,000,000 $10,000,000 $8,000,000 $8,000,000 $6,000,000 $6,000,000 $4,000,000 $4,000,000 $2,000,000 Average of Salary 2007 $2,000,000 Aver SO Average of
Find the answer
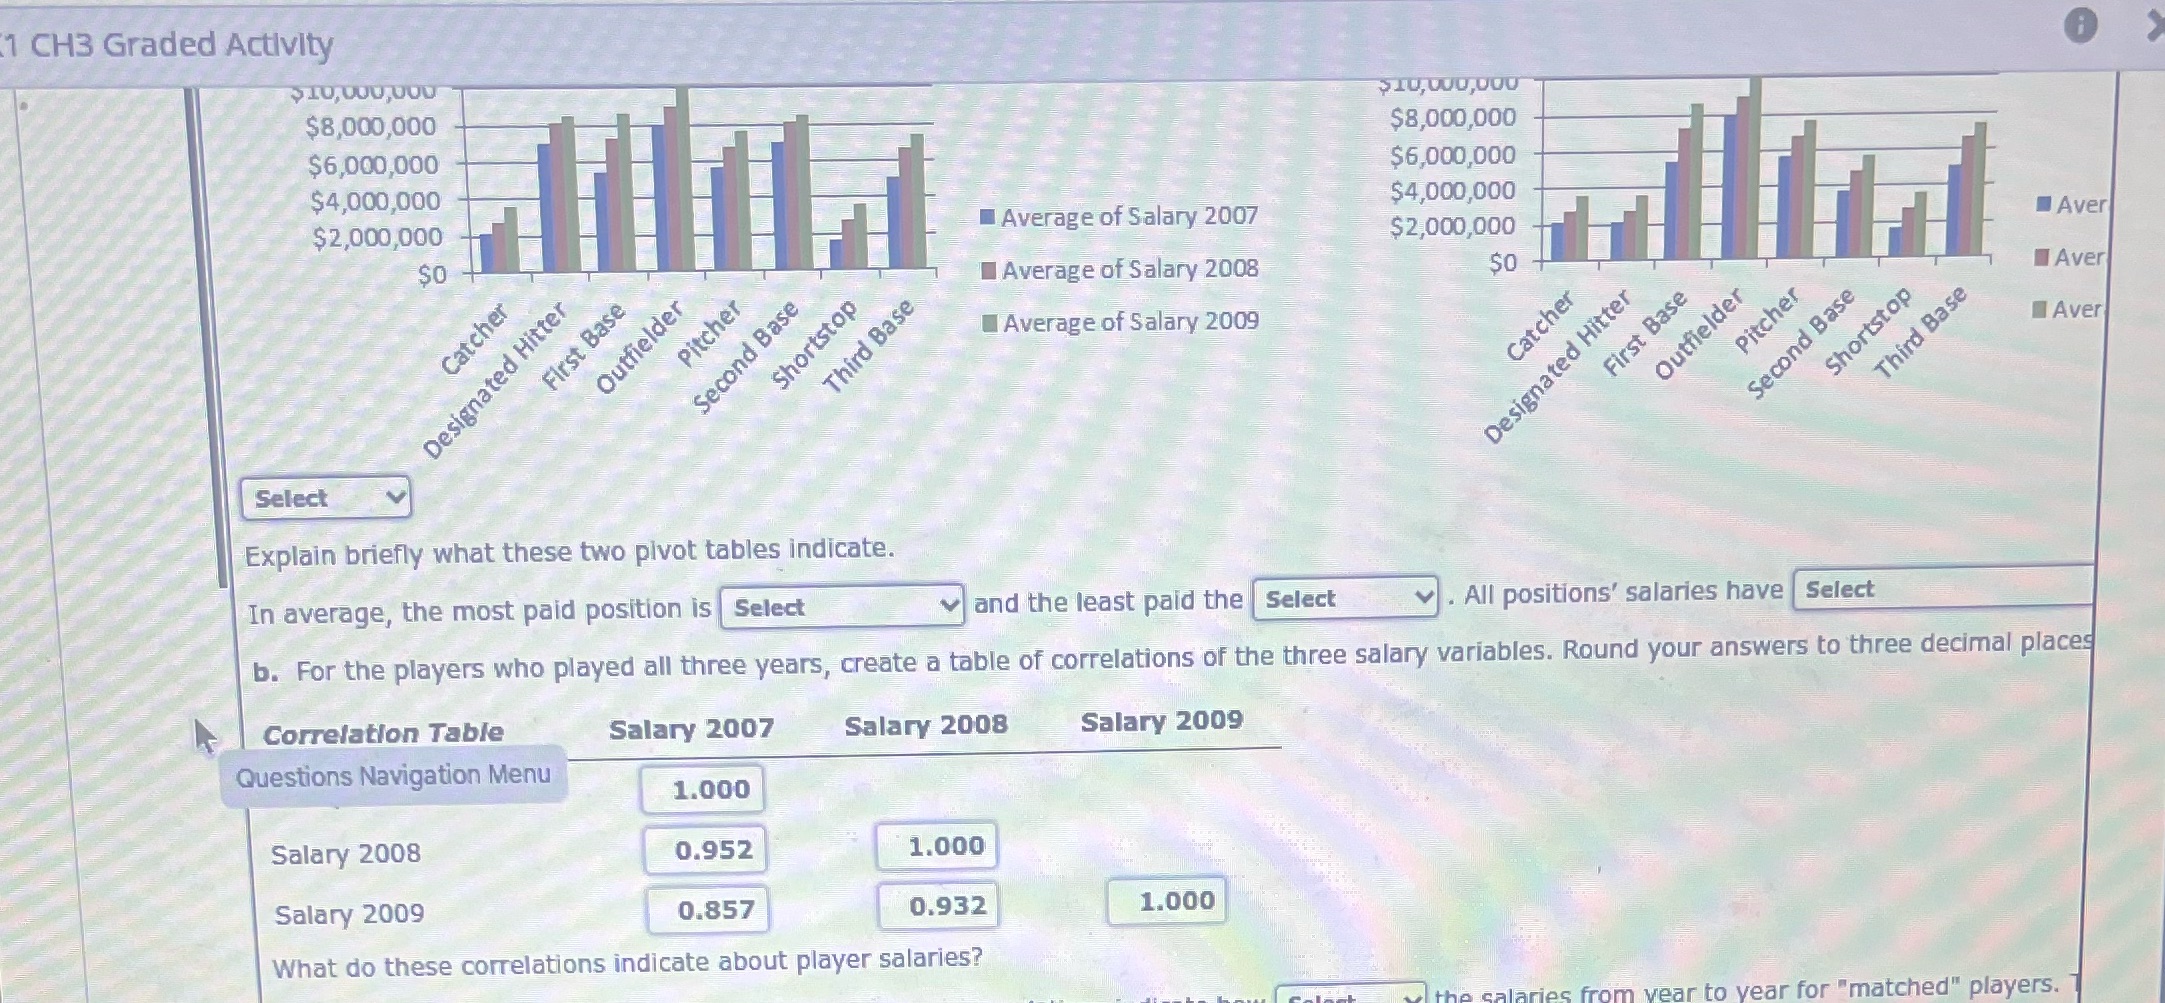
1 CH3 Graded Activity 10,000,000 $10,000,000 $8,000,000 $8,000,000 $6,000,000 $6,000,000 $4,000,000 $4,000,000 $2,000,000 Average of Salary 2007 $2,000,000 Aver SO Average of Salary 2008 50 Aver Catch First Base Outfielder Shortstop Third Base Average of Salary 2009 Catcher fielder Pitcher Aver Shortstop ird Base Pi Second Base First Ba Second Base Designated Hitter Designated Hitter Out Select Explain briefly what these two pivot tables indicate. In average, the most paid position is Select and the least paid the Select v . All positions' salaries have Select b. For the players who played all three years, create a table of correlations of the three salary variables. Round your answers to three decimal places Correlation Table Salary 2007 Salary 2008 Salary 2009 Questions Navigation Menu 1.000 Salary 2008 0.952 1.000 Salary 2009 0.857 0.932 1.000 What do these correlations indicate about player salaries? from wear to year for "matched" players
Step by Step Solution
There are 3 Steps involved in it

Get step-by-step solutions from verified subject matter experts