

Question: Find the Four - Period simple moving average forecasts for Periods 5,6 and 7 Find Mean Absolute Deviation Find Mean Absolute Percentage Error begin{tabular}{|c|c|l|l|l|} hline
Find the Four - Period simple moving average forecasts for Periods 5,6 and 7
Find Mean Absolute Deviation
Find Mean Absolute Percentage Error
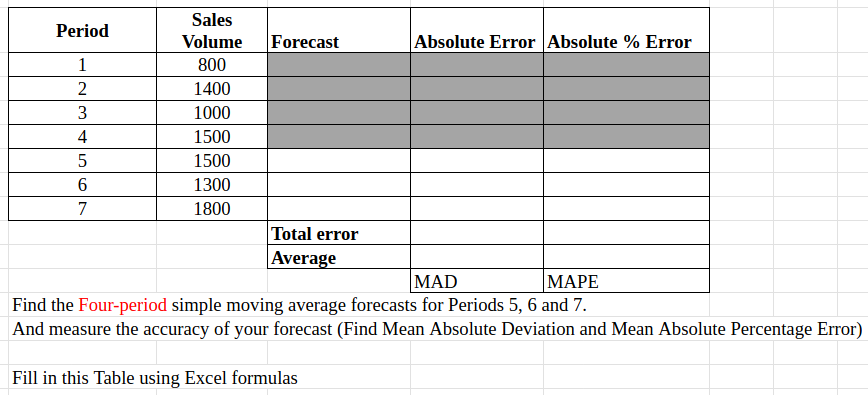
\begin{tabular}{|c|c|l|l|l|} \hline Period & SalesVolume & Forecast & Absolute Error & Absolute \% Error \\ \hline 1 & 800 & & & \\ \hline 2 & 1400 & & & \\ \hline 3 & 1000 & & & \\ \hline 4 & 1500 & & & \\ \hline 5 & 1500 & & & \\ \hline 6 & 1300 & & & \\ \hline 7 & 1800 & & & \\ \hline & & Total error & & \\ \hline & Average & & \\ \hline & & MAD & MAPE \\ \hline \end{tabular} Find the Four-period simple moving average forecasts for Periods 5, 6 and 7. And measure the accuracy of your forecast (Find Mean Absolute Deviation and Mean Absolute Percentage Error) Fill in this Table using Excel formulas \begin{tabular}{|c|c|l|l|l|} \hline Period & SalesVolume & Forecast & Absolute Error & Absolute \% Error \\ \hline 1 & 800 & & & \\ \hline 2 & 1400 & & & \\ \hline 3 & 1000 & & & \\ \hline 4 & 1500 & & & \\ \hline 5 & 1500 & & & \\ \hline 6 & 1300 & & & \\ \hline 7 & 1800 & & & \\ \hline & & Total error & & \\ \hline & Average & & \\ \hline & & MAD & MAPE \\ \hline \end{tabular} Find the Four-period simple moving average forecasts for Periods 5, 6 and 7. And measure the accuracy of your forecast (Find Mean Absolute Deviation and Mean Absolute Percentage Error) Fill in this Table using Excel formulas
Step by Step Solution
There are 3 Steps involved in it

Get step-by-step solutions from verified subject matter experts