

Question: Find the MAD and MSE for Method 1 (Table 1) and Method 2 (Table 2). Following are two weekly forecasts made by two different methods
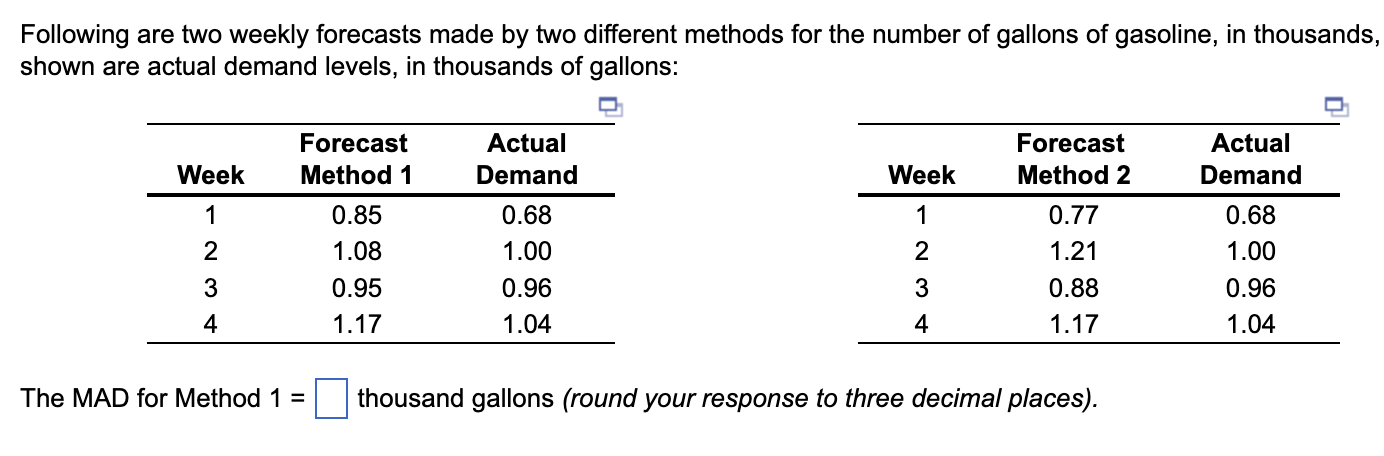 Find the MAD and MSE for Method 1 (Table 1) and Method 2 (Table 2).
Step by Step Solution
There are 3 Steps involved in it
1 Expert Approved Answer
Step: 1 Unlock

Question Has Been Solved by an Expert!
Get step-by-step solutions from verified subject matter experts
Step: 2 Unlock
Step: 3 Unlock