

Question: find the missing numbers in the following chart please begin{tabular}{|c|c|c|c|} hline & 2023 & 2024 & 2025 hline Gross Sales & $290,000 & &
find the missing numbers in the following chart please 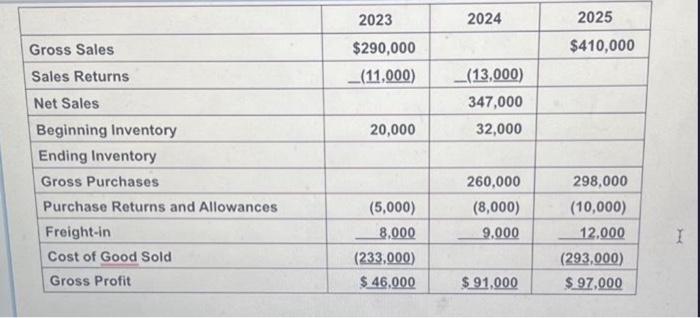
\begin{tabular}{|c|c|c|c|} \hline & 2023 & 2024 & 2025 \\ \hline Gross Sales & $290,000 & & $410,000 \\ \hline Sales Returns & (11,000) & (13,000) & \\ \hline Net Sales & & 347,000 & 4 \\ \hline Beginning Inventory & 20,000 & 32,000 & \\ \hline \multicolumn{4}{|l|}{ Ending Inventory } \\ \hline Gross Purchases & & 260,000 & 298,000 \\ \hline Purchase Returns and Allowances & (5,000) & (8,000) & (10,000) \\ \hline Freight-in & 8,000 & 9.000 & 12,000 \\ \hline Cost of Good Sold & (233,000) & & (293,000) \\ \hline Gross Profit & $46,000 & $91,000 & $97,000 \\ \hline \end{tabular}
Step by Step Solution
There are 3 Steps involved in it
1 Expert Approved Answer
Step: 1 Unlock

Question Has Been Solved by an Expert!
Get step-by-step solutions from verified subject matter experts
Step: 2 Unlock
Step: 3 Unlock