

Question: Find the range, mean, and standard deviation for the data set. 18, 22, 18, 19, 21, 21, 22, 20, 21, 19 Find the range,
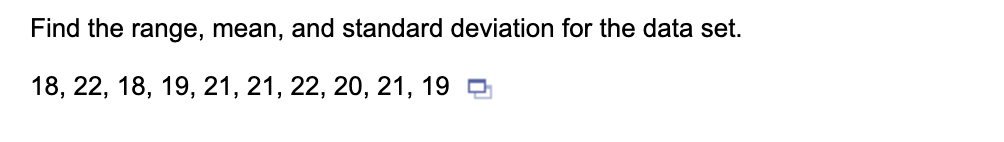
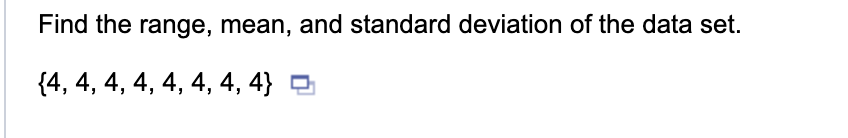
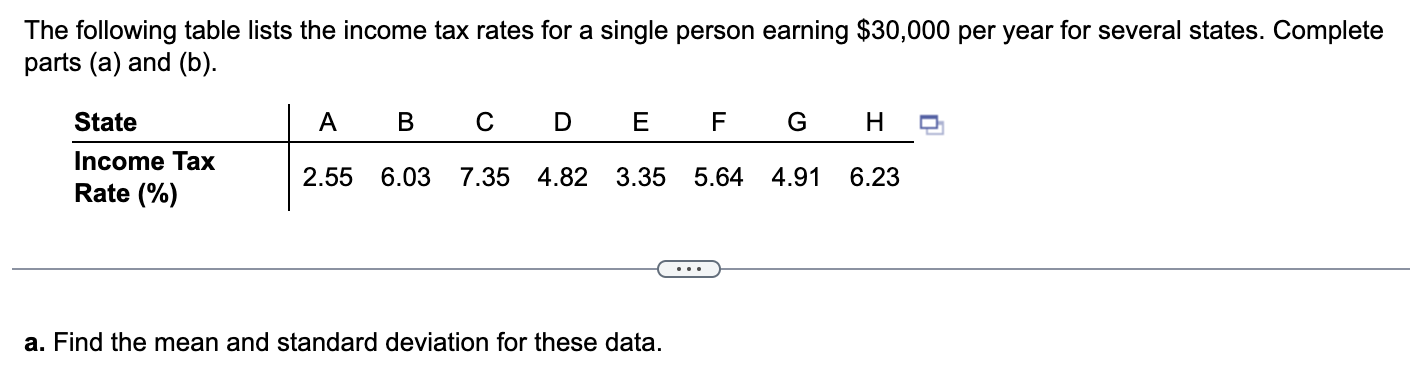


Find the range, mean, and standard deviation for the data set. 18, 22, 18, 19, 21, 21, 22, 20, 21, 19 Find the range, mean, and standard deviation of the data set. {4, 4, 4, 4, 4, 4, 4, 4} The following table lists the income tax rates for a single person earning $30,000 per year for several states. Complete parts (a) and (b). State A B C D E F G H Income Tax Rate (%) 2.55 6.03 7.35 4.82 3.35 5.64 4.91 6.23 a. Find the mean and standard deviation for these data. 0 Suppose for a given month, the mean daily closing price for stock A was 130.13 and the standard deviation was 13.9. For stock B, the mean daily closing price was 81.52 with a standard deviation of 7.7. Which stock was more volatile? Stocks with greater coefficients of variation are considered more volatile. Find the range, mean, and standard deviation of the data set. {10, 16, 10, 5, 5, 14, 2, 4}
Step by Step Solution
There are 3 Steps involved in it

Get step-by-step solutions from verified subject matter experts