

Question: Find the standard deviation, s, of sample data summarized in the frequency distribution table below by using the formula below, where x represents the class
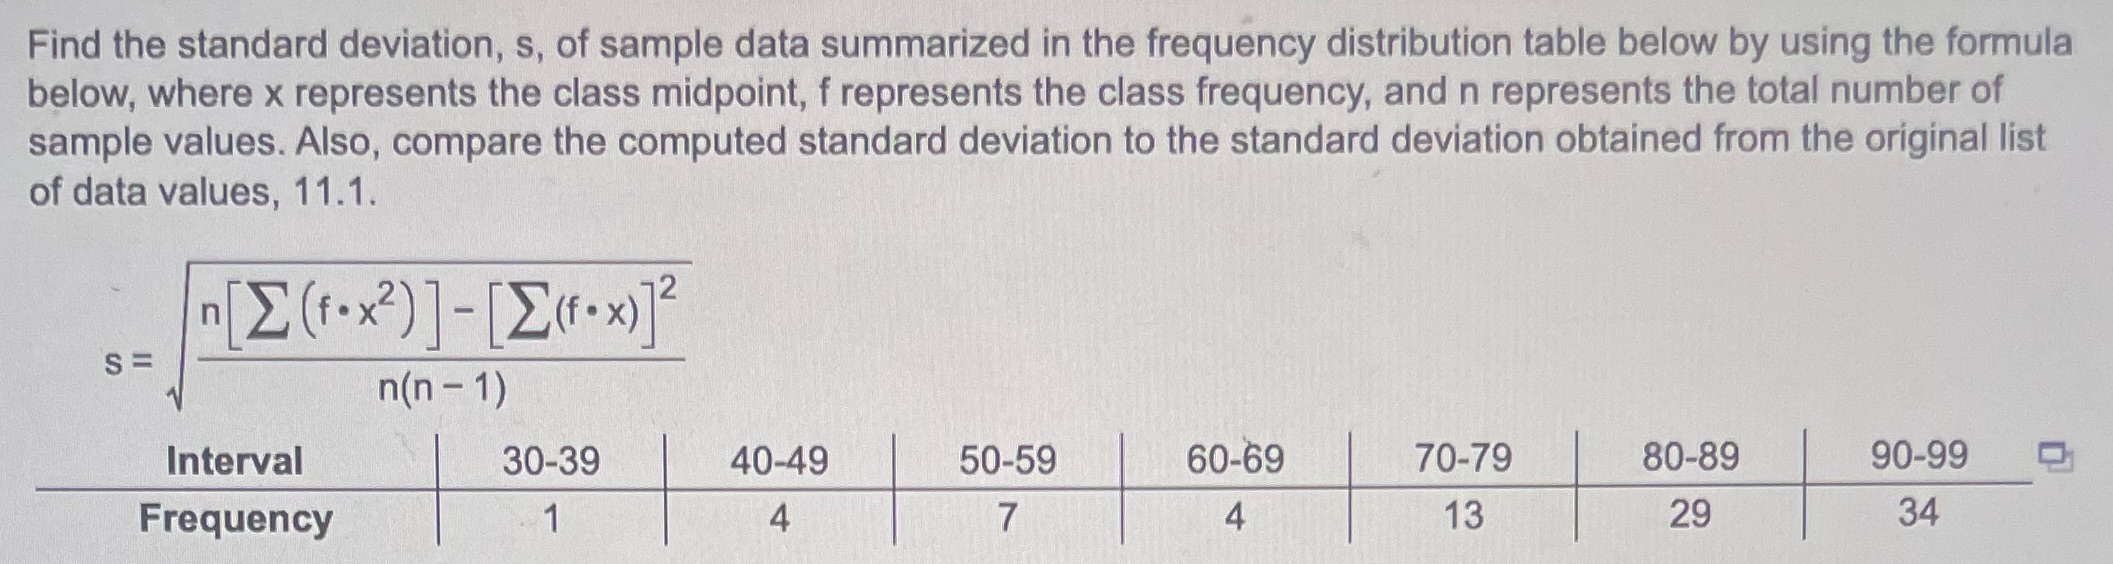
Find the standard deviation, s, of sample data summarized in the frequency distribution table below by using the formula below, where x represents the class midpoint, f represents the class frequency, and n represents the total number of sample values. Also, compare the computed standard deviation to the standard deviation obtained from the original list of data values, 11.1. [E (F. x 2 ) ] - [ E(. x ) ] 2 S= n(n - 1) Interval 30-39 40-49 50-59 60-69 70-79 80-89 90-99 Frequency 1 4 7 4 13 29 34
Step by Step Solution
There are 3 Steps involved in it
1 Expert Approved Answer
Step: 1 Unlock

Question Has Been Solved by an Expert!
Get step-by-step solutions from verified subject matter experts
Step: 2 Unlock
Step: 3 Unlock