

Question: Find the standard deviation, s, of sample data summarized in the frequency distribution table below by using the formula below, where x represents the class
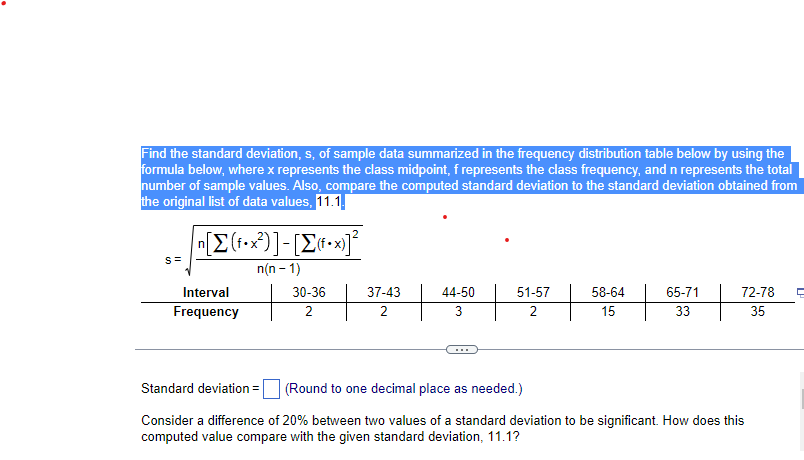

Find the standard deviation, s, of sample data summarized in the frequency distribution table below by using the formula below, where x represents the class midpoint, f represents the class frequency, and n represents the total number of sample values. Also, compare the computed standard deviation to the standard deviation obtained from the original list of data values, 11.1. "[E (fox ) ]-[2(.x )] S= n(n - 1) Interval 30-36 37-43 44-50 51-57 58-64 65-71 72-78 Frequency 2 2 3 2 15 33 35 Standard deviation = (Round to one decimal place as needed.) Consider a difference of 20% between two values of a standard deviation to be significant. How does this computed value compare with the given standard deviation, 1
Step by Step Solution
There are 3 Steps involved in it

Get step-by-step solutions from verified subject matter experts