

Question: Find the standard deviation s of sample data summarized in the frequency distributor represents the class frequency and n represents the total number of sample
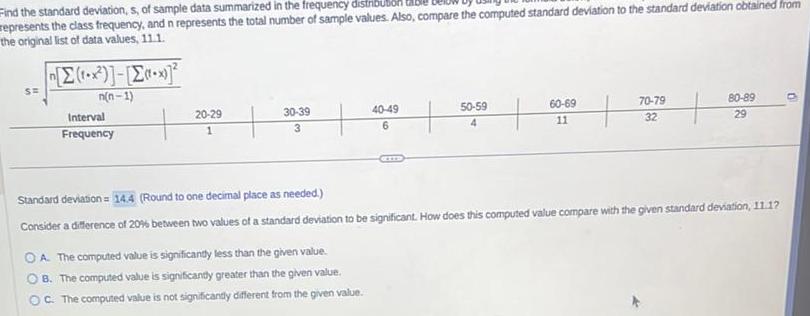

Find the standard deviation s of sample data summarized in the frequency distributor represents the class frequency and n represents the total number of sample values Also compare the computed standard deviation to the standard deviation obtained from the original list of data values 11 1 S 1 x x n n 1 Interval Frequency 20 29 30 39 3 40 49 6 OA The computed value is significantly less than the given value B The computed value is significantly greater than the given value OC The computed value is not significantly different from the given value 50 59 4 60 69 11 70 79 32 80 89 29 Standard deviation 14 4 Round to one decimal place as needed Consider a difference of 20 between two values of a standard deviation to be significant How does this computed value compare with the given standard deviation 11 1
Step by Step Solution
There are 3 Steps involved in it

Get step-by-step solutions from verified subject matter experts