

Question: Five observations taken for two variables follow 4 2 6 11 4 14 40 50 30 60 20 a. Which of the following scatter diagrams
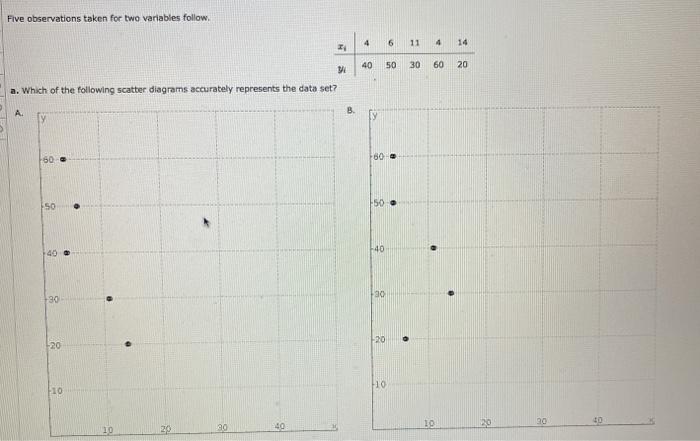
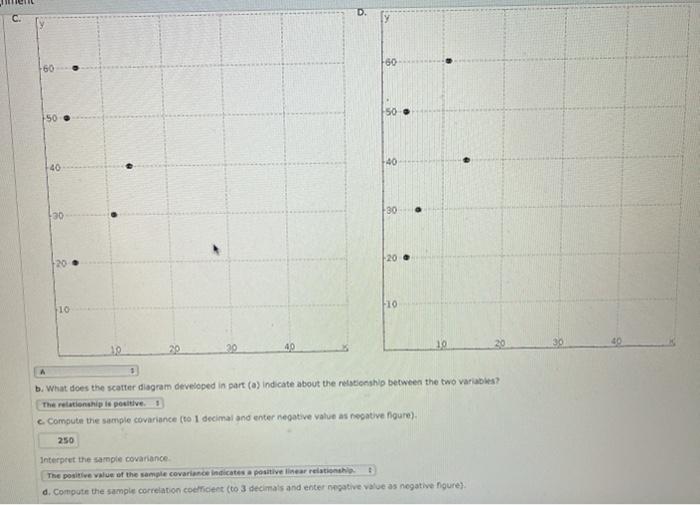
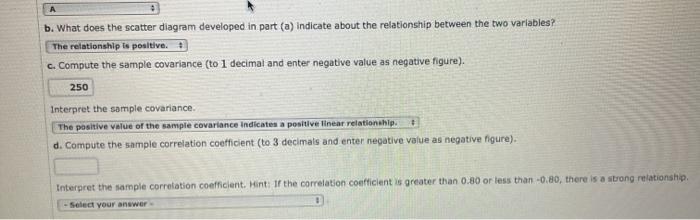
Five observations taken for two variables follow 4 2 6 11 4 14 40 50 30 60 20 a. Which of the following scatter diagrams accurately represents the data set? B A. y 60 60 So -50 -40 40 30 30 20 20 +10 10 10 10 20 29 39 ed 20 D. 60 60 50 150 40 40 30 30 10 -10 40 30 10 2: 20 29 40 A b. What does the scatter diagram developed in part (o) indicate about the relationship between the two variables? The relationship is positive Compute the sample covariance (to 1 decimal and enter negative value as negative figure) 250 Interpret the sample covariance The positive value of the sample covariance indicates a positive linear relationshi d. Compute the sample correlation coefficient (to 3 decimals and enter negative value as negative Toure) b. What does the scatter diagram developed in part (a) indicate about the relationship between the two variables? The relationship is positive. c. Compute the sample covariance (to 1 decimal and enter negative value as negative figure). 250 Interpret the sample covariance. The positive value of the sample covariance Indicates a positive linear relationship d. Compute the sample correlation coefficient (to 3 decimals and enter negative value as negative figure). Interpret the sample correlation coefficient. Hint: If the correlation coefficients greater than 0.80 or less than 0.80, there is a strong relationship Select your
Step by Step Solution
There are 3 Steps involved in it

Get step-by-step solutions from verified subject matter experts