

Question: 24. Five observations taken for two variables follow. X; 4 6 11 3 16 yi 50 50 40 60 30 a. Develop a scatter diagram
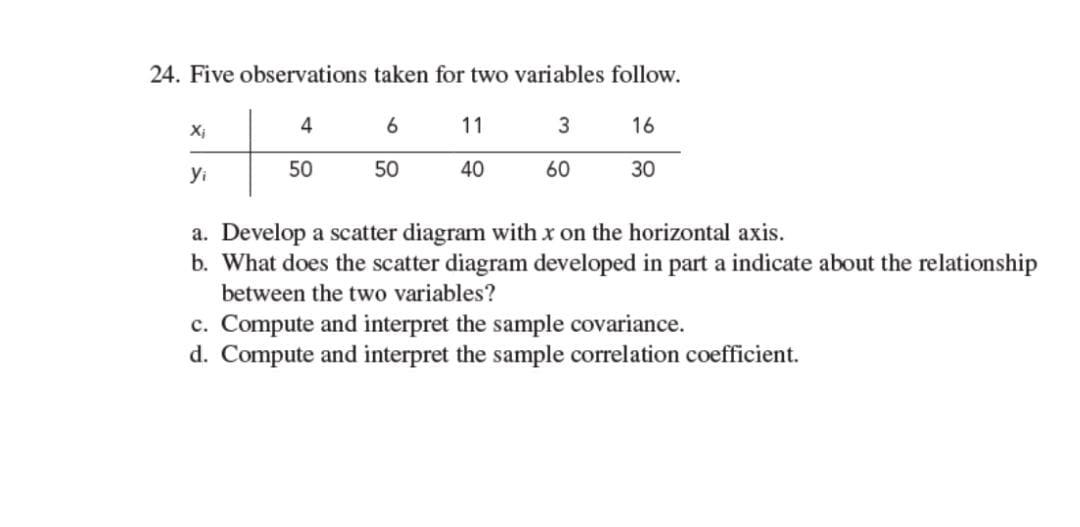
24. Five observations taken for two variables follow. X; 4 6 11 3 16 yi 50 50 40 60 30 a. Develop a scatter diagram with x on the horizontal axis. b. What does the scatter diagram developed in part a indicate about the relationship between the two variables? c. Compute and interpret the sample covariance. d. Compute and interpret the sample correlation coefficient
Step by Step Solution
There are 3 Steps involved in it
1 Expert Approved Answer
Step: 1 Unlock

Question Has Been Solved by an Expert!
Get step-by-step solutions from verified subject matter experts
Step: 2 Unlock
Step: 3 Unlock