

Question: Five observations taken for two variables follow. (a) Develop a scatter diagram for these data. (b) What does the scatter diagram indicate about the relationship
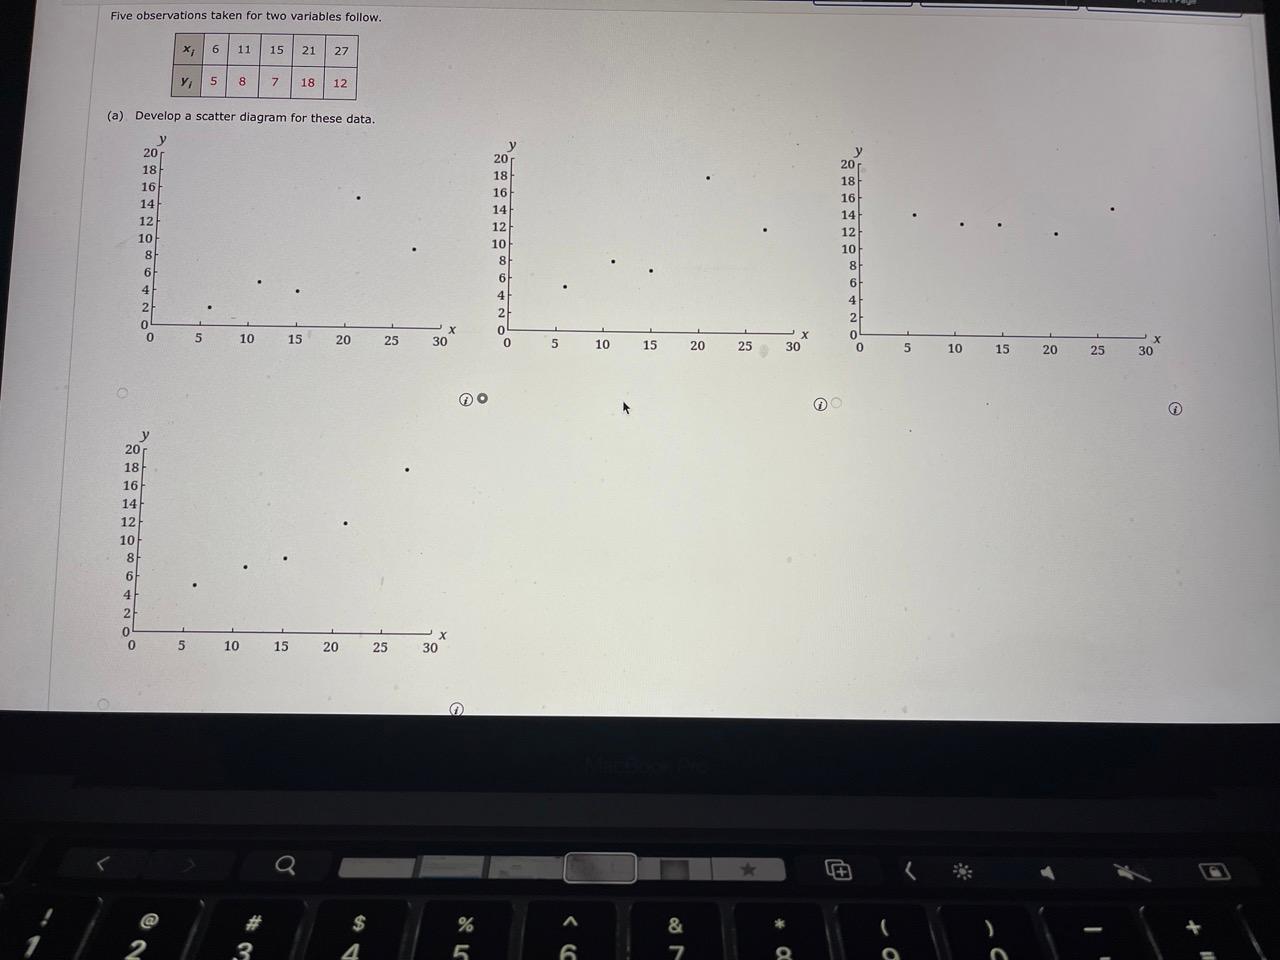
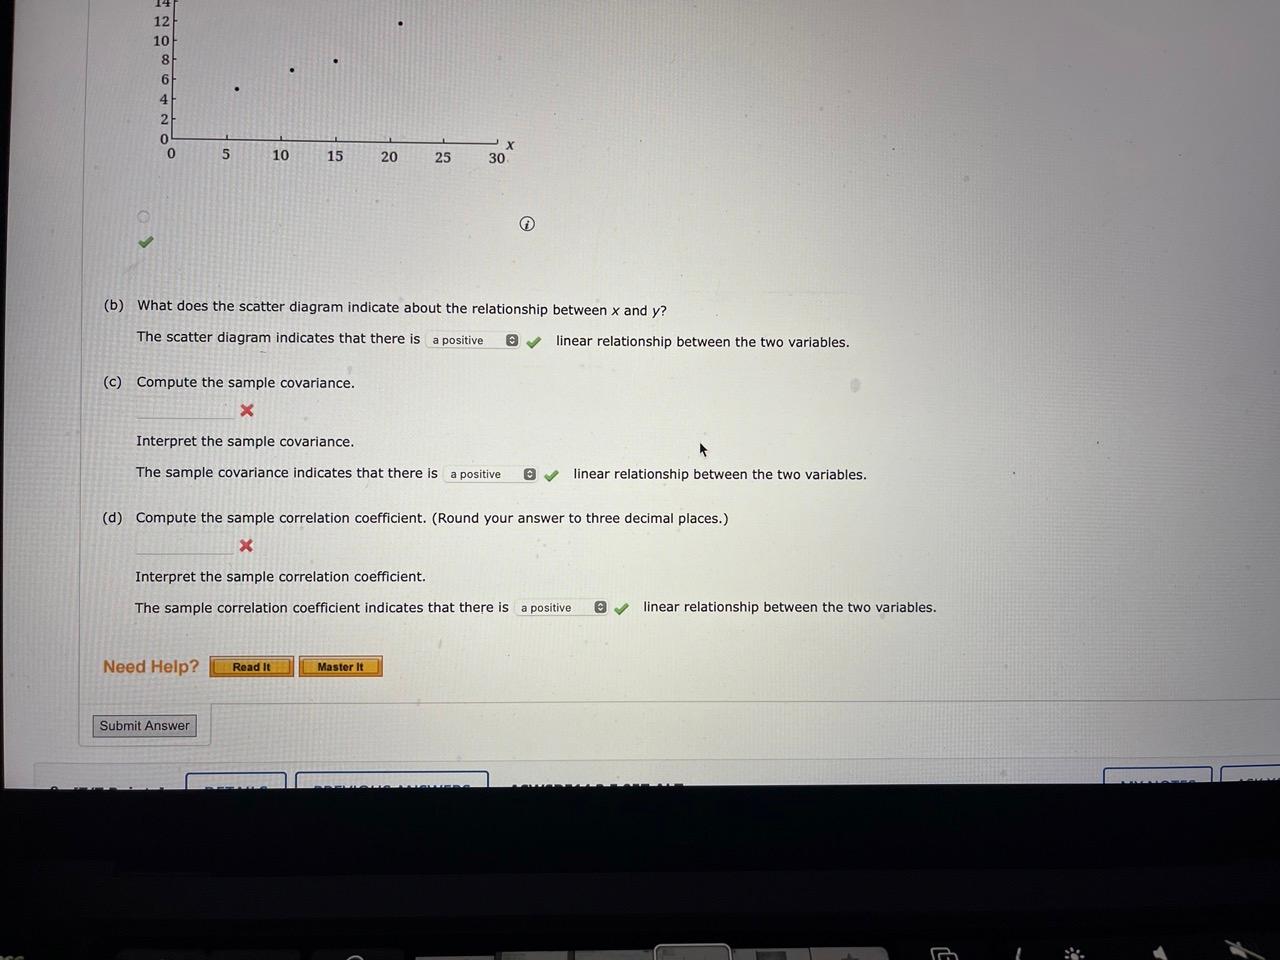
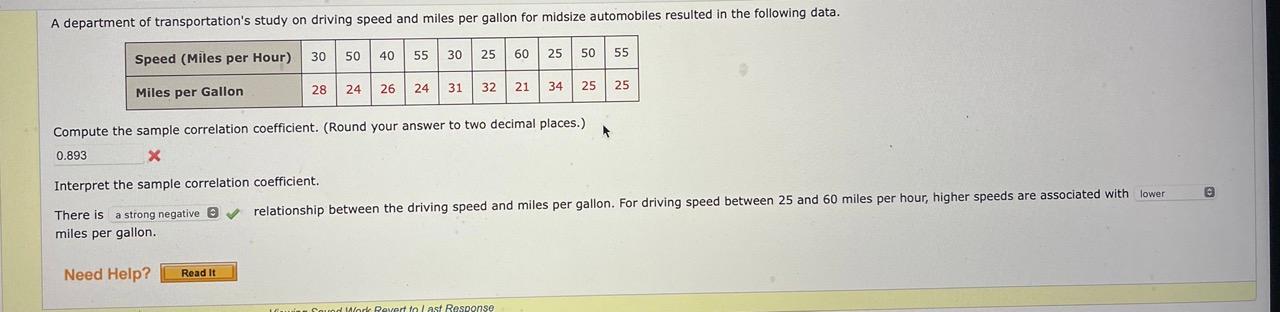
Five observations taken for two variables follow. (a) Develop a scatter diagram for these data. (b) What does the scatter diagram indicate about the relationship between x and y ? The scatter diagram indicates that there is linear relationship between the two variables. (c) Compute the sample covariance. Interpret the sample covariance. The sample covariance indicates that there is linear relationship between the two variables. (d) Compute the sample correlation coefficient. (Round your answer to three decimal places.) Interpret the sample correlation coefficient. The sample correlation coefficient indicates that there is linear relationship between the two variables. A department of transportation's study on driving speed and miles per gallon for midsize automobiles resulted in the following data. Compute the sample correlation coefficient. (Round your answer to two decimal places.) Interpret the sample correlation coefficient. There is relationship between the driving speed and miles per gallon. For driving speed between 25 and 60 miles per hour, higher speeds are associated with miles per gallon. Five observations taken for two variables follow. (a) Develop a scatter diagram for these data. (b) What does the scatter diagram indicate about the relationship between x and y ? The scatter diagram indicates that there is linear relationship between the two variables. (c) Compute the sample covariance. Interpret the sample covariance. The sample covariance indicates that there is linear relationship between the two variables. (d) Compute the sample correlation coefficient. (Round your answer to three decimal places.) Interpret the sample correlation coefficient. The sample correlation coefficient indicates that there is linear relationship between the two variables. A department of transportation's study on driving speed and miles per gallon for midsize automobiles resulted in the following data. Compute the sample correlation coefficient. (Round your answer to two decimal places.) Interpret the sample correlation coefficient. There is relationship between the driving speed and miles per gallon. For driving speed between 25 and 60 miles per hour, higher speeds are associated with miles per gallon
Step by Step Solution
There are 3 Steps involved in it

Get step-by-step solutions from verified subject matter experts