

Question: Flow Condition # 3 : The channel slope was kept at S 0 = 0 . 0 2 2 7 and the sluice gate was
Flow Condition #: The channel slope was kept at and the sluice gate was removed. The removal of the sluice gate reduced the elevation difference between tail tank and head tank and consequently the discharge increased slightly with respect to flow condition # With the sluice gate removed, the depth at the upstream end of the flume is not forced to be equal to the opening under the gate. The longitudinal profile changed, especially upstream of the jump.
Tasks: Measure discharge with the Venturi meter and calculate, again, critical flow depth and the normal depth Measure water depth along the channel with the point gauge at every length, starting at and end at Classify and compute the flow profiles using the gradually varied flow GVF equation ie the direct step method You are required to classify and compute the supercritical and subcritical flow profiles, and to compare your results with the measured depths given at sections every along the flume in the table at the end of the handout.
Supercritical flow profile: Recall that this calculation should start at its upstream end. Let denote the distance from the upstream end of the flume: This calculation can start with the measured flow depth of at feet. The supercritical flow tends asymptotically to the uniform flow condition. Calculation should then proceed downstream until the depth is close to Do not try to use in your calculation the measured values of that go down and up because of experimental error. The supercritical flow profile should then be computed for depths in the range
Subcritical flow profile: Recall that this calculation should start at its downstream end. This calculation can start with the measured flow depth of at The calculation should proceed upstream until a section just upstream of the jump, with depth Estimate beforehand the depth at which the calculation would end. The depth can be estimated using the conjugate depth relation assuming that the supercritical flow became uniform, iethe depth upstream of the jump The subcritical flow profile should then be computed for depths in the range
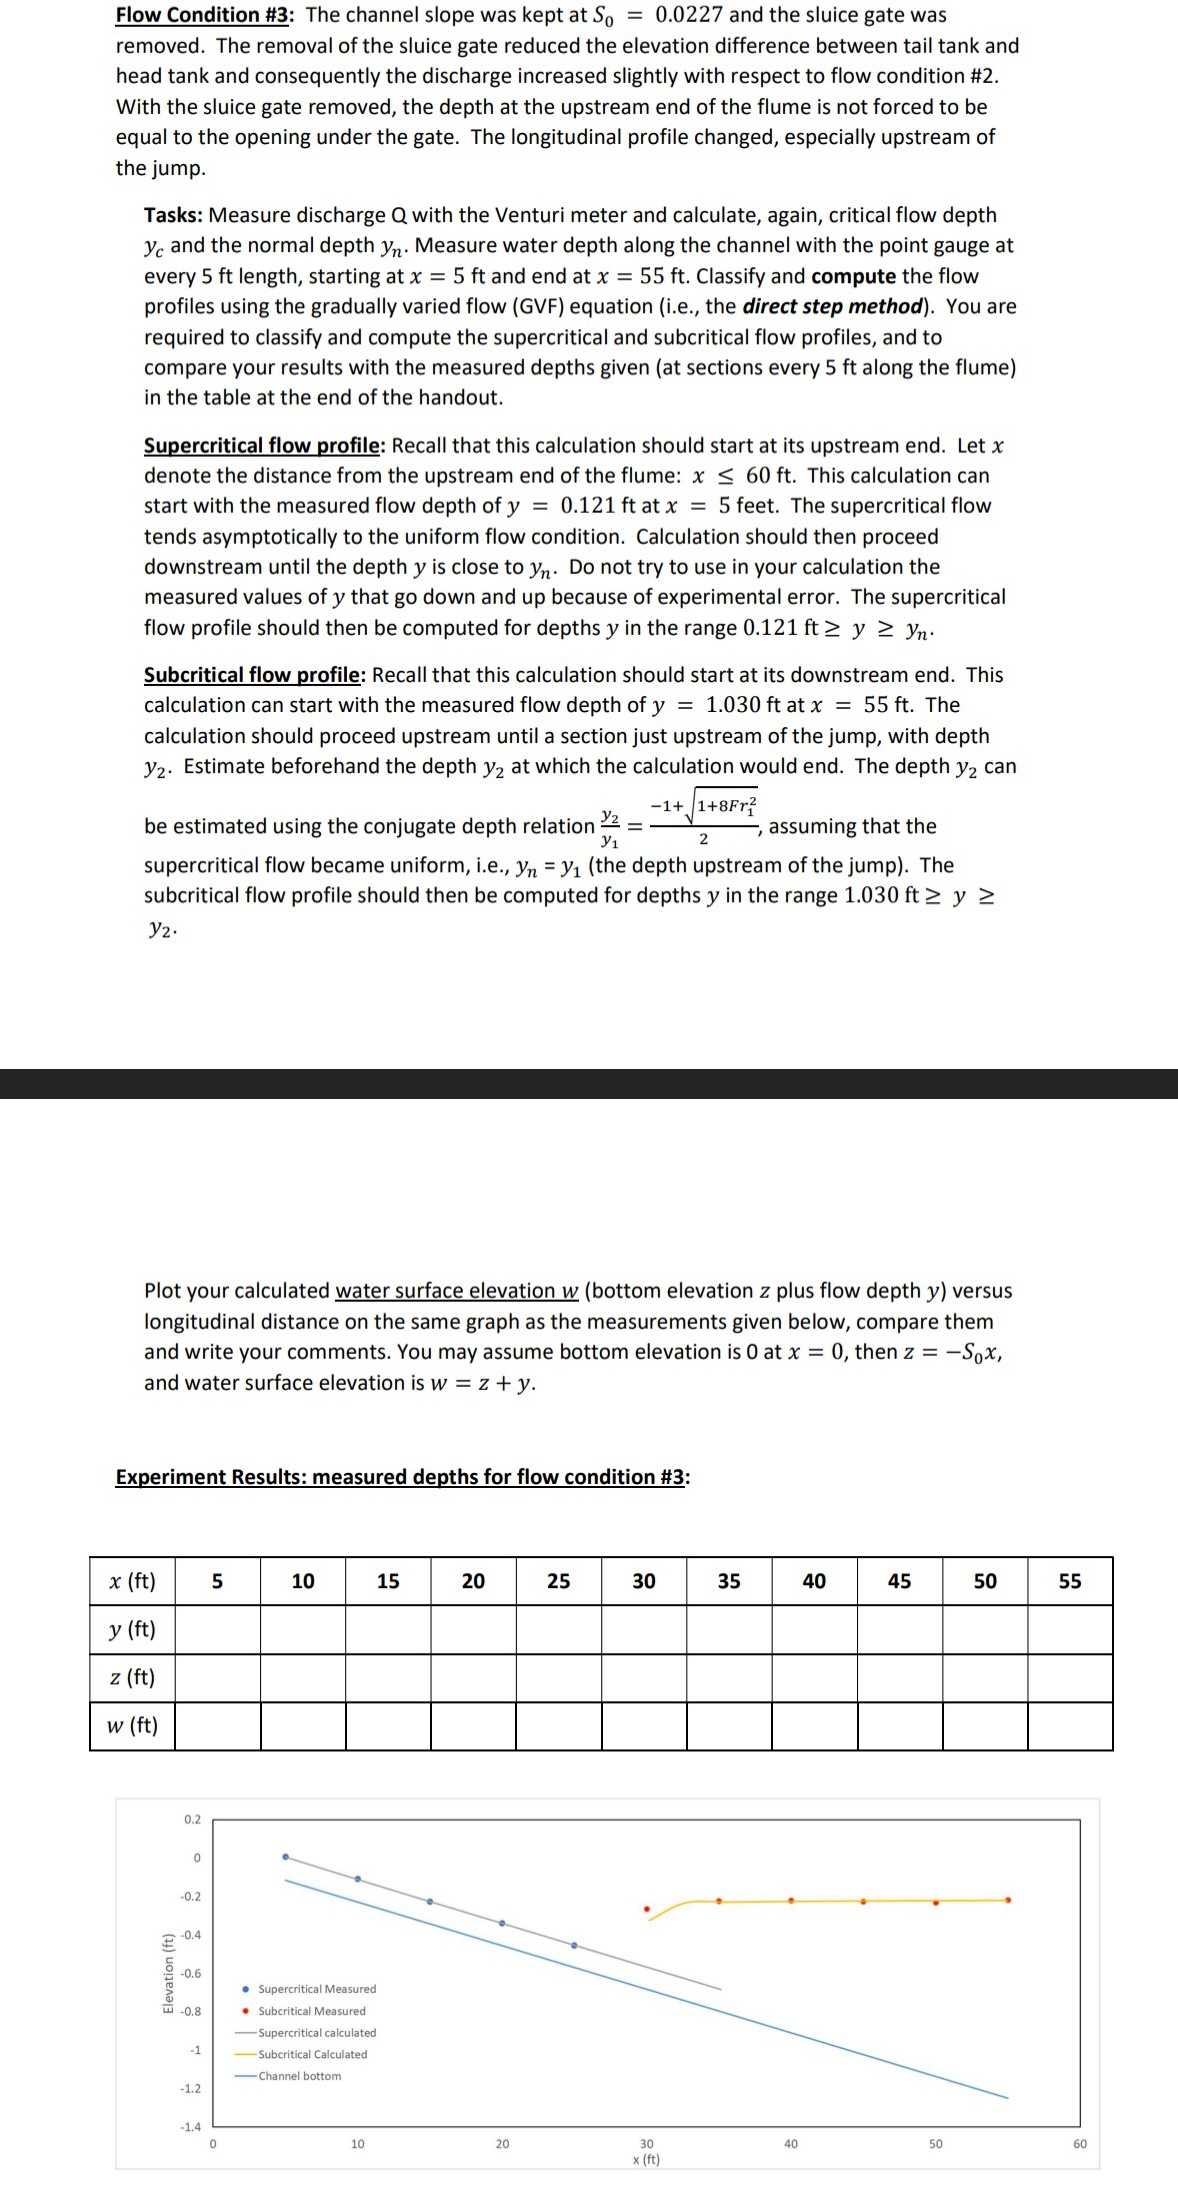
Plot your calculated water surface elevation bottom elevation plus flow depth versus longitudinal distance on the same graph as the measurements given below, compare them and write your comments. You may assume bottom elevation is at then and water surface elevation is
Experiment Results: measured depths for flow condition #:
table
Step by Step Solution
There are 3 Steps involved in it
1 Expert Approved Answer
Step: 1 Unlock

Question Has Been Solved by an Expert!
Get step-by-step solutions from verified subject matter experts
Step: 2 Unlock
Step: 3 Unlock