

Question: Follow the steps below to create the following graph: a ) Assign 8 to the variapie A ( amp tude ) . b ) Assign
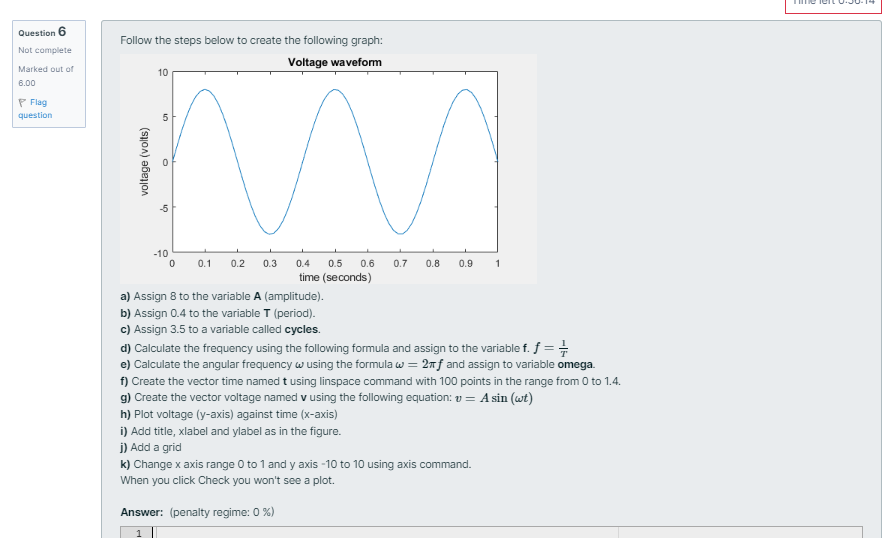
Follow the steps below to create the following graph:
a Assign to the variapie amptude
b Assign to the variable period
c Assign to a variable called cycles.
d Calculate the frequency using the following formula and assign to the variable f
e Calculate the angular frequency using the formula and assign to variable omega.
f Create the vector time named using linspace command with points in the range from to
g Create the vector voltage named using the following equation: Asin
h Plot voltage axis against time axis
i Add title, xlabel and ylabel as in the figure.
j Add a grid
k Change axis range to and axis to using axis command.
When you click Check you won't see a plot.
Answer: penalty regime:
Step by Step Solution
There are 3 Steps involved in it
1 Expert Approved Answer
Step: 1 Unlock

Question Has Been Solved by an Expert!
Get step-by-step solutions from verified subject matter experts
Step: 2 Unlock
Step: 3 Unlock