

Question: Following are the results from two different simple regression analyses, estimating the costs of the purchasing department using number of purchase orders and number
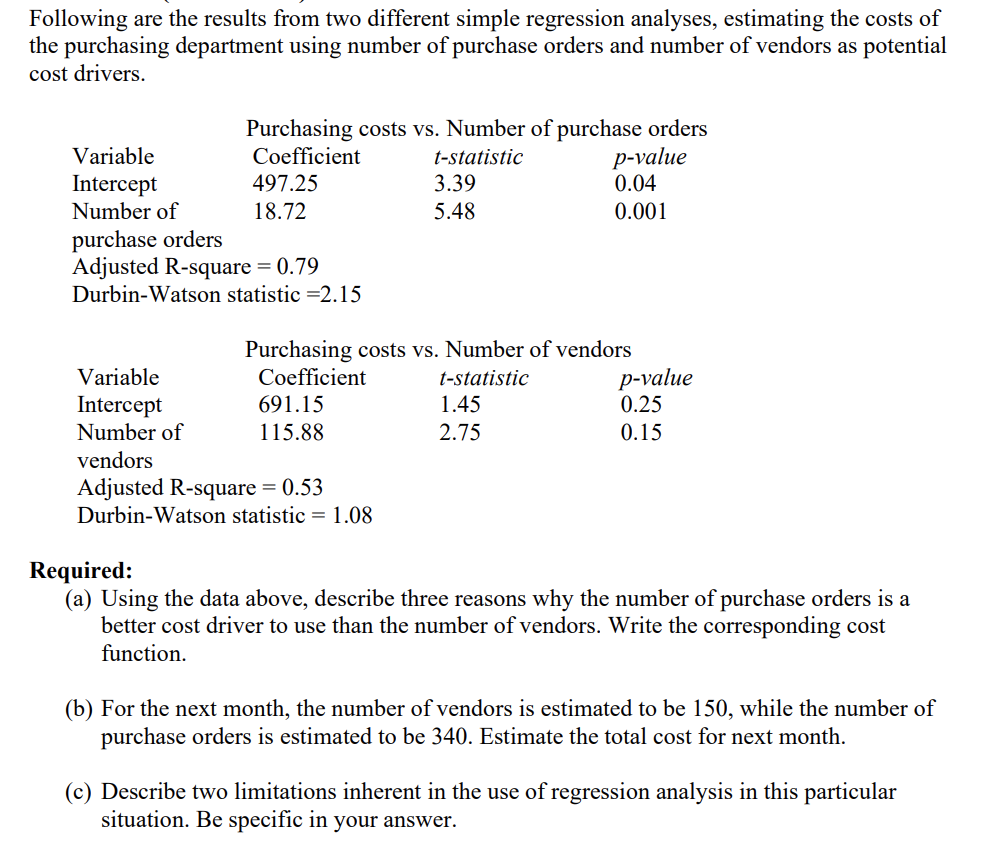
Following are the results from two different simple regression analyses, estimating the costs of the purchasing department using number of purchase orders and number of vendors as potential cost drivers. Purchasing costs vs. Number of purchase orders Variable Intercept Number of Coefficient 497.25 18.72 t-statistic 3.39 5.48 p-value 0.04 0.001 purchase orders Adjusted R-square = 0.79 Durbin-Watson statistic =2.15 Purchasing costs vs. Number of vendors Variable Coefficient Intercept 691.15 Number of 115.88 vendors t-statistic 1.45 2.75 p-value 0.25 0.15 Adjusted R-square = 0.53 Durbin-Watson statistic = 1.08 Required: (a) Using the data above, describe three reasons why the number of purchase orders is a better cost driver to use than the number of vendors. Write the corresponding cost function. (b) For the next month, the number of vendors is estimated to be 150, while the number of purchase orders is estimated to be 340. Estimate the total cost for next month. (c) Describe two limitations inherent in the use of regression analysis in this particular situation. Be specific in your answer.
Step by Step Solution
There are 3 Steps involved in it
Lets address each part of the question a Three reasons why the number of purchase orders is a better cost driver than the number of vendors 1 Direct I... View full answer

Get step-by-step solutions from verified subject matter experts