

Question: Following are two weekly forecasts made by two different methods for the number of gallons ofgasoline, in thousands, demanded at a local gasoline station. Also
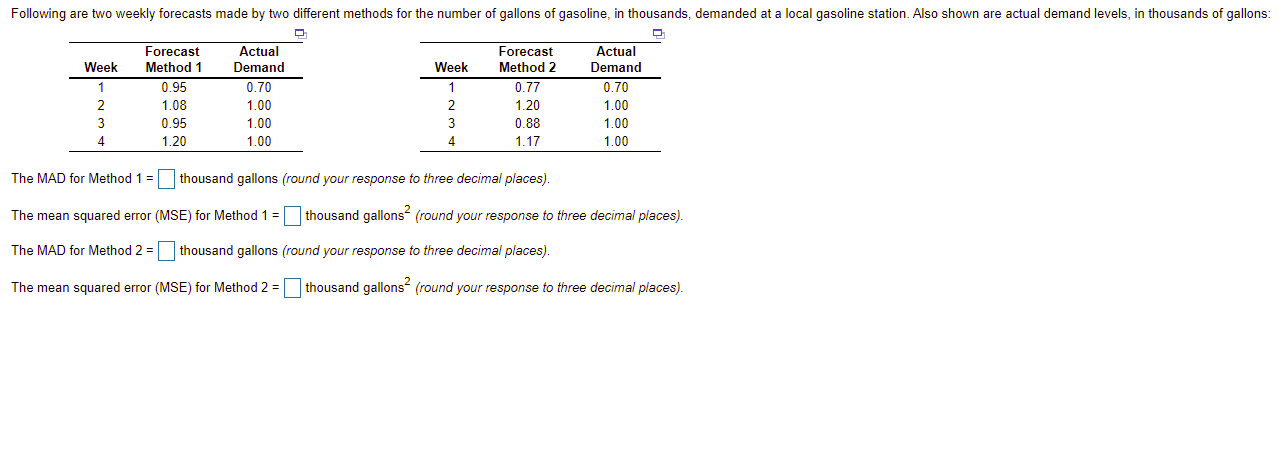
Following are two weekly forecasts made by two different methods for the number of gallons ofgasoline, in thousands, demanded at a local gasoline station. Also shown are actual demand levels. in thousands of gallons E1 E1 Forecast Actual Forecast Actual Week Method 1 Demand Week Method 2 Demand 1 0.95 0.70 1 0.77 0.70 2 1.03 1.00 2 1.20 1.00 3 0.95 1.00 3 0.88 1.00 :1 1 20 1 00 4 1.17 1 00 The MAD for Method 1 = thousand gallons {round your response to three decr'malplaces). The mean squared error [MSE] for Method 1 = thousand gallons2 (round your response to three decimal places}. The MAD for Method 2 = thousand gallons {round your response to three deor'malplaces}. The mean squared error (MSE) for Method 2 = thousand gallons2 {round your response to three decimal places)
Step by Step Solution
There are 3 Steps involved in it

Get step-by-step solutions from verified subject matter experts