

Question: Following are two weekly forecasts made by two different methods for the number of gallons of gasoline, in thousands, demanded at a local gasoline station.
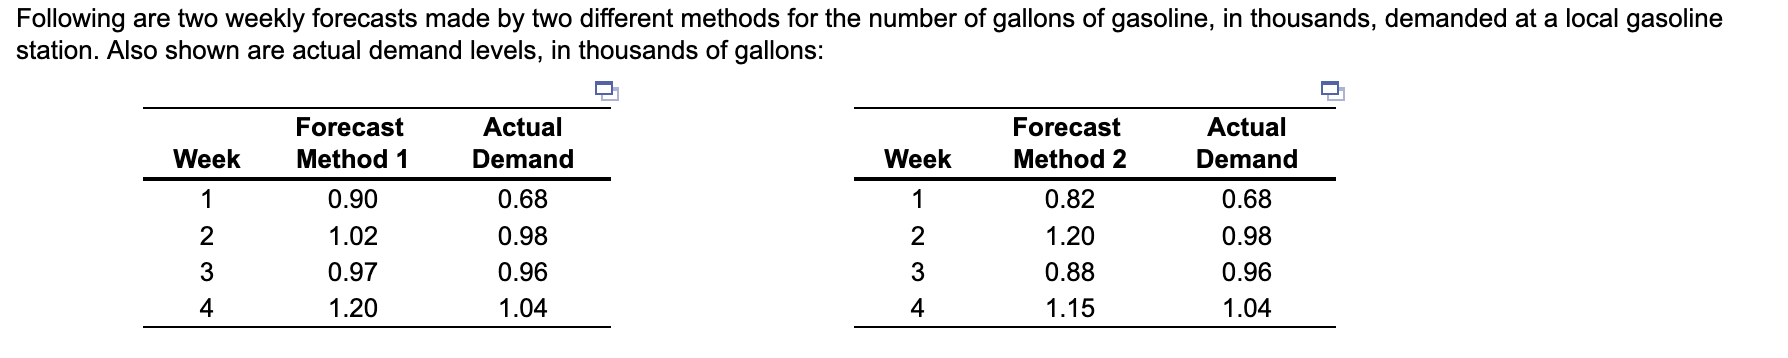
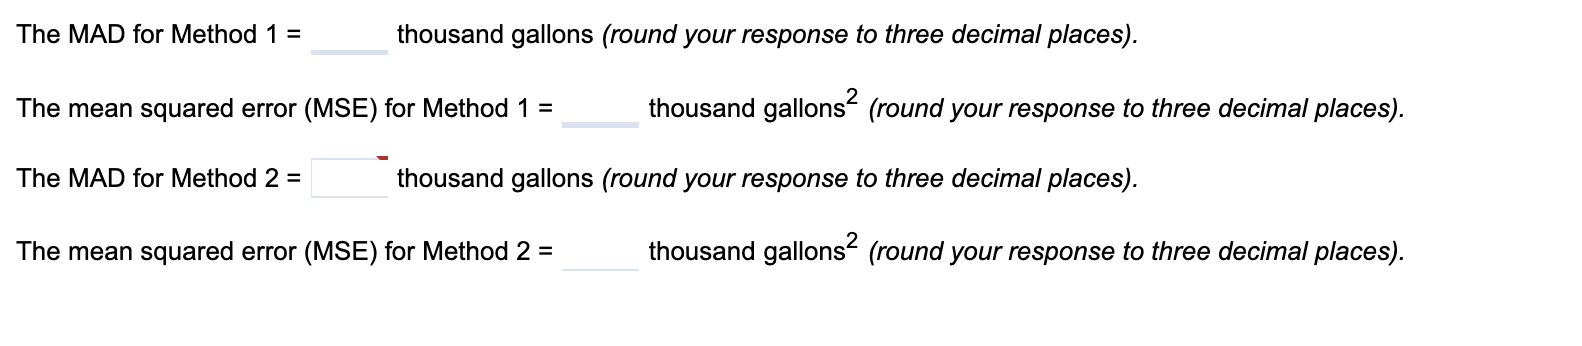
Following are two weekly forecasts made by two different methods for the number of gallons of gasoline, in thousands, demanded at a local gasoline station. Also shown are actual demand levels, in thousands of gallons: \begin{tabular}{ccc} \hline Week & ForecastMethod1 & ActualDemand \\ \hline 1 & 0.90 & 0.68 \\ 2 & 1.02 & 0.98 \\ 3 & 0.97 & 0.96 \\ 4 & 1.20 & 1.04 \\ \hline \end{tabular} \begin{tabular}{ccc} \hline Week & ForecastMethod2 & ActualDemand \\ \hline 1 & 0.82 & 0.68 \\ 2 & 1.20 & 0.98 \\ 3 & 0.88 & 0.96 \\ 4 & 1.15 & 1.04 \\ \hline \end{tabular} The MAD for Method 1= thousand gallons (round your response to three decimal places). The mean squared error (MSE) for Method 1= thousand gallons 2 (round your response to three decimal places). The MAD for Method 2 = thousand gallons (round your response to three decimal places). The mean squared error (MSE) for Method 2= thousand gallons 2 (round your response to three decimal places)
Step by Step Solution
There are 3 Steps involved in it

Get step-by-step solutions from verified subject matter experts