

Question: Following are two weekly forecasts made by two different methods for the number of gallons of gasoline, in thousands, demanded at a local gasoline station.
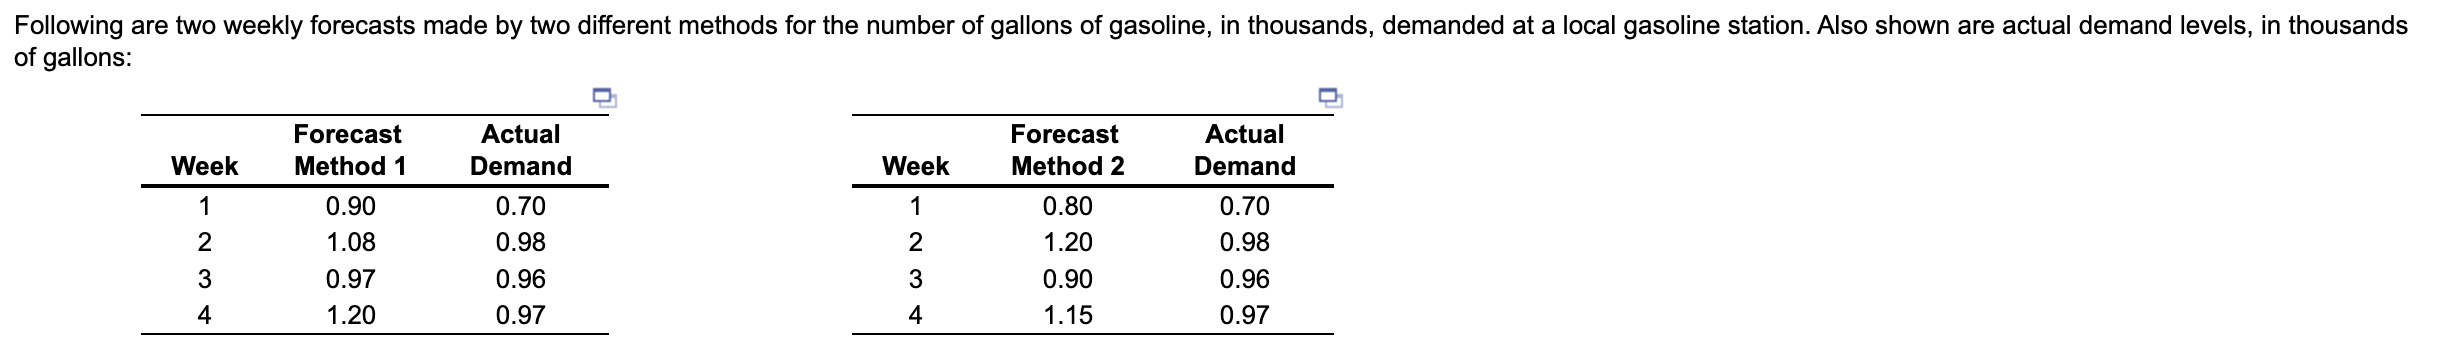 Following are two weekly forecasts made by two different methods for the number of gallons of gasoline, in thousands, demanded at a local gasoline station. Also shown are actual demand levels, in thousands of gallons:
1. What is MAD for method 1?
2. What is MSE for method 1?
3. What is MAD for method 2?
4. What is MSE for method 2?
of gallons: \begin{tabular}{ccc} \hline Week & ForecastMethod1 & ActualDemand \\ \hline 1 & 0.90 & 0.70 \\ 2 & 1.08 & 0.98 \\ 3 & 0.97 & 0.96 \\ 4 & 1.20 & 0.97 \\ \hline \end{tabular} \begin{tabular}{ccc} \hline Week & ForecastMethod2 & ActualDemand \\ \hline 1 & 0.80 & 0.70 \\ 2 & 1.20 & 0.98 \\ 3 & 0.90 & 0.96 \\ 4 & 1.15 & 0.97 \\ \hline \end{tabular}
Step by Step Solution
There are 3 Steps involved in it

Get step-by-step solutions from verified subject matter experts